Figures & data
Table 1. Characteristics of the 22 AML patients older than 75 with mutated NPM1.
Table 2. Detailed characteristics of the two patients receiving intensive chemotherapy with daunorubicin and cytarabine (DA).
Figure 1. AML-associated mutations, immunophenotypic characteristics and karyotype of 22 NPM1-mutated AML patients. Each column represents a single patient. ‘APL-like’, ‘Acute promyelocytic leukemia’-like phenotype i.e. CD34-/HLA-DR-. Five patients displayed two different TET2 mutations and one patient two different BCOR mutations.
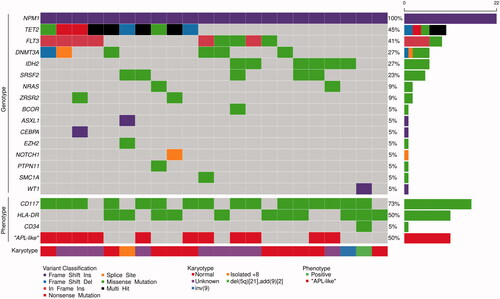
Figure 2. Gene mutation frequencies (%) of TET2, DNMT3A, IDH2, FLT3-ITD and SRSF2 in NPM1-mutated AML comparing data from the present study (n = 22; leftmost) with those of another cohort of older patients by Renaud et al. [Citation29] (n = 17; middle left) and two series of younger AML patients by Papaemmanuil et al. [Citation4] (n = 418, middle right) and Ivey et al. [Citation28] (n = 223, rightmost). p-values as determined by Fisher’s exact test are shown for comparisons of the gene mutation frequencies with those of the present study.
![Figure 2. Gene mutation frequencies (%) of TET2, DNMT3A, IDH2, FLT3-ITD and SRSF2 in NPM1-mutated AML comparing data from the present study (n = 22; leftmost) with those of another cohort of older patients by Renaud et al. [Citation29] (n = 17; middle left) and two series of younger AML patients by Papaemmanuil et al. [Citation4] (n = 418, middle right) and Ivey et al. [Citation28] (n = 223, rightmost). p-values as determined by Fisher’s exact test are shown for comparisons of the gene mutation frequencies with those of the present study.](/cms/asset/d27a7f51-e0ef-4e46-a9e9-8fa59032b31d/ilal_a_1894650_f0002_c.jpg)
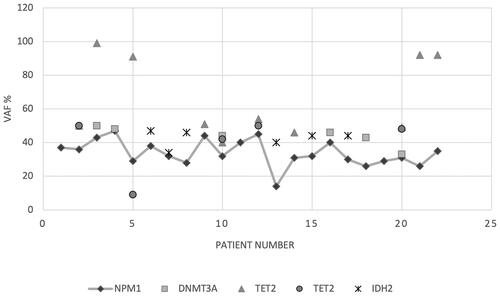
Figure 3. Variant allele frequency (VAF%) of coexisting mutations in DNA methylation genes (DNMT3A, TET2 and IDH2) compared to NPM1 VAF% among the 22 AML patients. Three patients (#1, 11 and 19) lacked a mutation in either of these genes. For TET2, two different mutations were found in five patients, displayed by different symbols (patients #2, 5, 10, 12 and 20). All NPM1 VAF% values are connected with a gray line for easier read-out.