Figures & data
Table 1. Program information.
Table 2. Student support.
Table 3. Students’ goals when enrolling in program.
Table 4. Curriculum.
Table 5. Graduation requirements and job search.
Figure 1. Student demographics by program type.
Note. Combined demographics across 34 PhD programs and 5 DSW programs that reported both their total enrollment and the percentage of their students belonging to each demographic group (PhD student N=967; DSW student N=491).
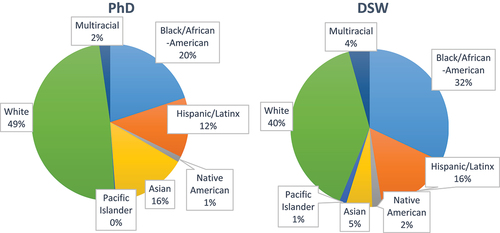
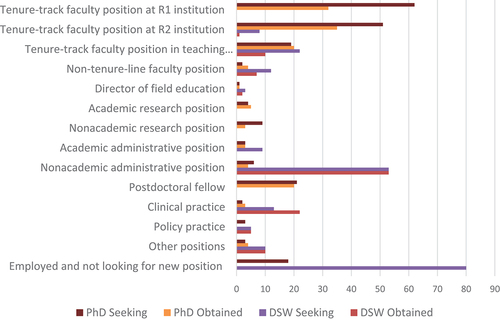
Figure 2. Students’ positions sought and obtained on the job market.
Note. Program directors were asked to provide the number of their students on the job market in 2018–2019 who were seeking each type of position as their primary preferred position as well as the number who obtained each type of position. Forty-one PhD directors and nine DSW directors reported on the positions sought by 204 PhD and 215 DSW students, respectively, with 37 PhD directors and nine DSW directors reporting positions obtained by 150 PhD and 167 DSW students. Adapted with permission from “CSWE/GADE Report on the Current Landscape of Doctoral Education in Social Work” by CSWE/GADE (Citation2021), pp. 41–42.