Figures & data
Figure 1. (Left) The routes used in the two scenarios. Numbers indicate the location of objects and the order in which they had to be identified. The northern route corresponds to Scenario A (first turning left), the southern one to Scenario B (first turning right). (Right) An overview of the objects in the two scenarios.
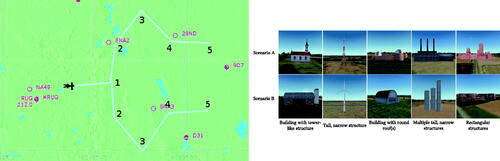
Table 1. Conditions (Belt, NoBelt) and scenarios (A or B) for each of the four groups of participants.
Figure 2. (Left) The numpad keys and their mapping to the eight vibe boards. “5” was used to initiate the vibration following a wizard-of-oz approach. (Right) The tactile belt used as part of this study, visible are two vibe boards (bottom), the power supply/battery (top left), and the microcontroller (top right).
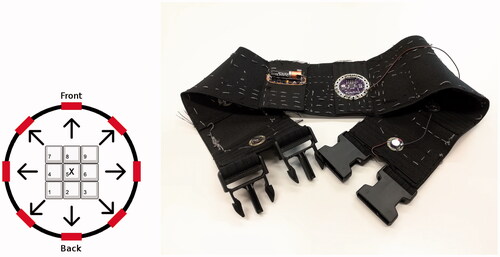
Figure 3. Experimental setup used in the study. The experimenter (left) monitors the participant’s performance and triggers vibrotactile cues to guide him to the next target along the route. The participant (right) controls a general aviation aircraft and tries to identify objects in the simulated environment while wearing eye tracking glasses and a tactile belt.
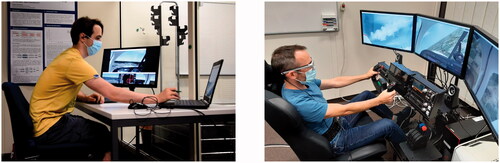
Figure 4. The study procedure the participants went through as part of the main study.
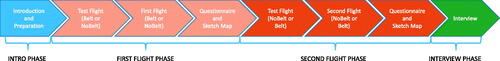
Figure 5. Set of sketch maps drawn by one of the participants after the flights. The identified objects are marked with crosses and numbered from 1 to 5.
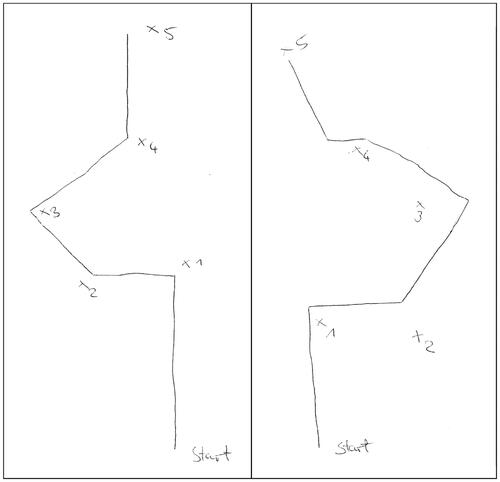
Table 2. Number of incorrect identifications, strikes and misses per condition, as well as the average time searching for objects per condition; with their Z and p values for a Wilcoxon signed rank test.
Table 3. Numeric results for sketch maps when subdivided by testing condition.
Figure 6. Results of the “raw” NASA-TLX questionnaires for the six categories and overall value for both conditions. Whiskers indicate standard error. Statistical significance marked by: *p < 0.05.
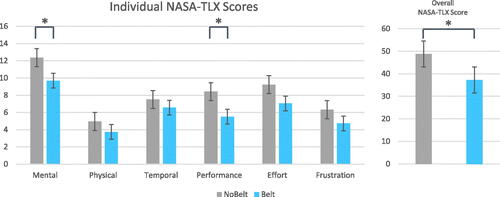
Figure 7. UEQ benchmark results for the six categories and both conditions. Whiskers indicate confidence intervals. Statistical significance marked by: *p < 0.05, **p < 0.01, ***p < 0.001.
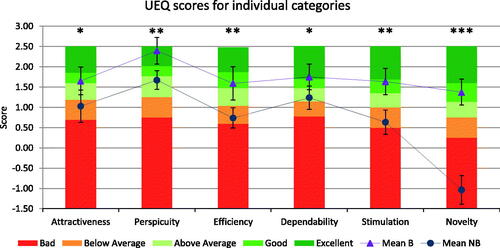
Figure 8. Exemplary scanpaths of one participant. A wider area was scanned when not assisted by the belt (left), whereas the scanning was more focused in the center of the middle display without the belt (right).
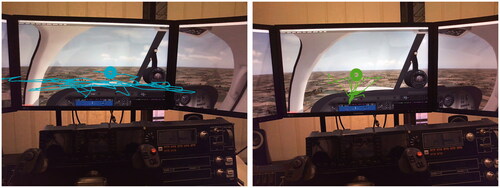
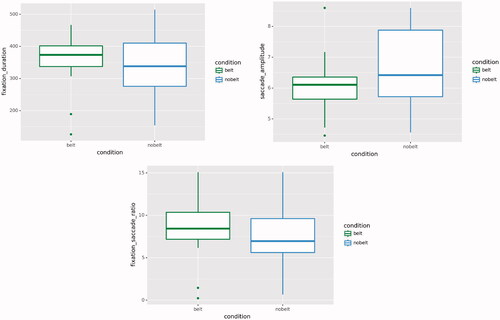
Figure 9. Boxplots of fixation duration (left) and saccade amplitude (right) and fixation saccade ratio (bottom) in the Belt and NoBelt conditions.