
Figures & data
Figure 1. The Virtuix Omni and HTC Vive tracker used in the experiments. The red circles on the left and right indicate the IMU sensor used for Virtuix Omni and the HTC Vive tracker.
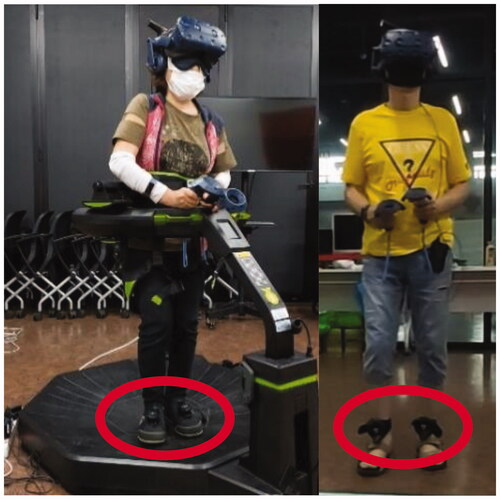
Figure 2. Base station used for overground walking environment. It tracks the feet of the participant.
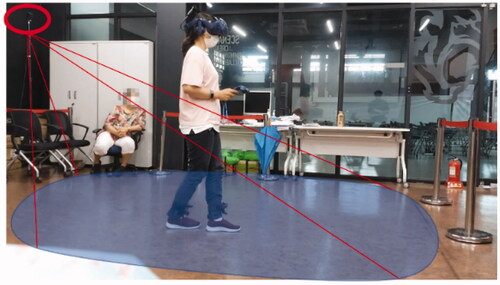
Figure 3. The ten routes used in Experiment 1. Participants with visual impairment are presented with four 3D-printed route blocks, and they choose a one block that shows the route they walked during the experiment by touching with hands. For a given path, the path may vary depending on the initial direction the participant is facing; therefore, an arrow is added to the starting point to make the direction right.
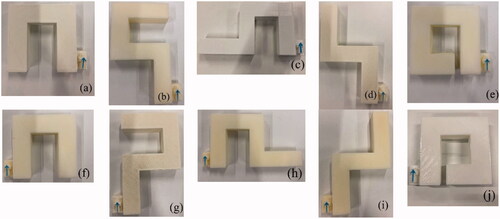
Figure 4. (a) The experiment apparatus in the walk-in-place environment. The monitor shows the surrounding environment according to the direction the participant’s head is facing so that the researcher can check the current status. (b) The scene in the monitor. The participants cannot see this scene because they are blind-folded.
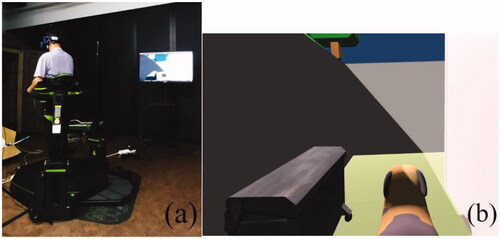
Figure 5. Experiment Flow of Experiment 1 (orange: first locomotion device experiment, green: second locomotion device experiment).
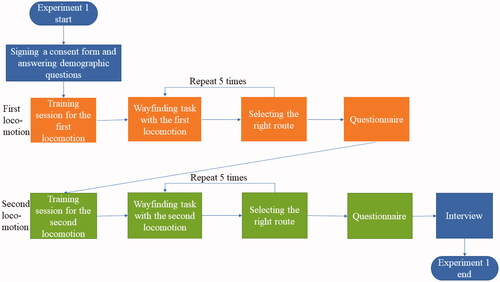
Figure 6. Correct memory from experiments 1 and 2 between two locomotion methods. Walk-in-place showed significantly better results than overground walking for memorizing routes. Conversely, overground walking showed significantly better results than walk-in-place for memorizing obstacles.
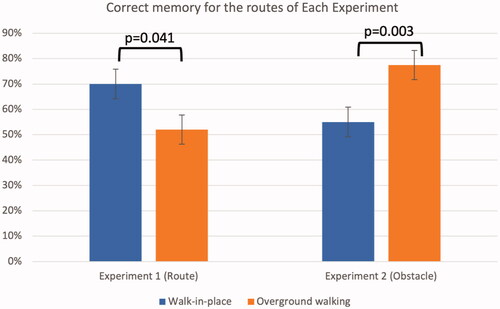
Figure 7. Results of Experiment 1 between two locomotion methods. (b, c) The number of collisions and errors show significant differences with p < 0.05. (d) The error times show significant differences with p < 0.001.
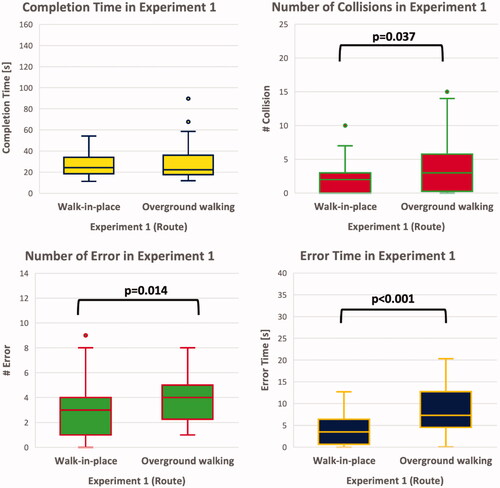
Figure 8. The line data of V6 in Experiment 1. Left image shows the path that V6 walked using walk-in-place and right image shows the path that V6 walked using overground walking.
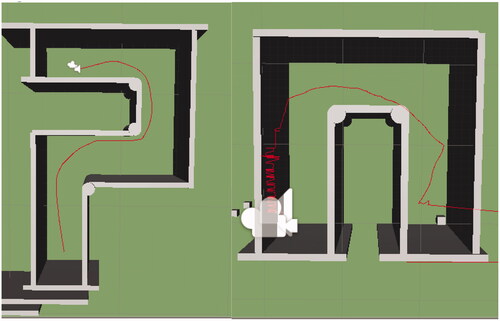
Figure 9. The location of obstacles on the paths used in Experiment 2 and the block models used in the evaluation. (a, b) The locations and kinds of obstacles on the paths. (c, d) Participants marked the location of each obstacle using LegoTM blocks.
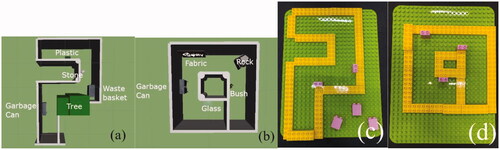
Figure 10. Experiment Flow of Experiment 2 (orange: first locomotion device experiment, green: second locomotion device experiment).
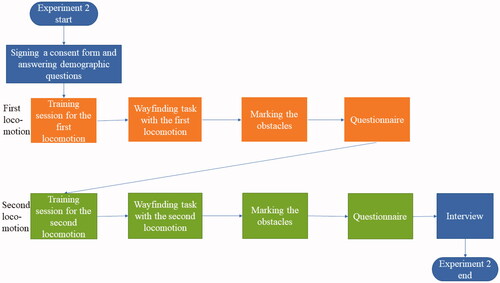
Figure 11. Results of Experiment 2 between two locomotion methods. (b) The number of collisions show significant differences with p < 0.05.
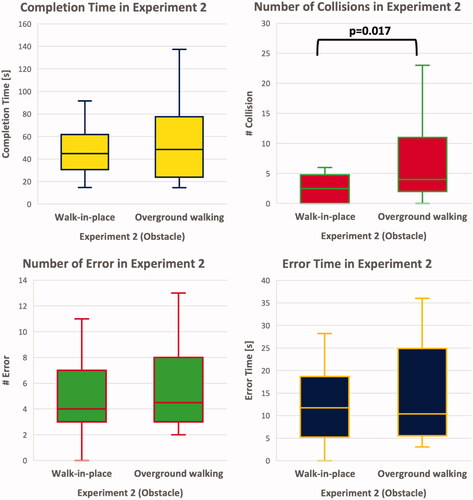
Table A1. Demographic information of participants with visual impairment.
Table A2. Questionnaire with 5-point likert scale used in both experiments.
Table A3. Individual results of obstacle detection (0: incorrect; 1: correct).