
Figures & data
Figure 1. Concentrations of ammonium-N (NH4-N, mg L−1), nitrite-N (NO2-N, mg L−1), nitrate-N (NO3-N, mg L−1, y-axis on the right-hand side), and turbidity (NTU) in the header tank water.
Figure 2. Addition of PAA, H2O2, and O3 over the course of experiment. PAA1 was added (15 L d−1, 5.2•10−3-5.4•10−3 L PAA m−3) into the inlet water and PAA2 (4–6 L d−1, 1.4•10−3-2.1•10−3 L PAA m−3) into the aeration system of the depuration tanks. H2O2 was added 20–200 L d−1 (0.00009–0.0009 L H2O2 m−3) to the circulating water and O3 30–50 L d−1 (0.010–0.018 L O3 m−3) to the inlet water.
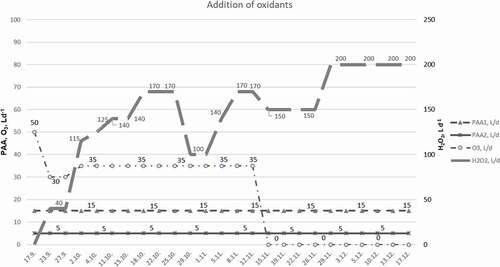
Figure 3. Concentrations of GSM and MIB (n = 4, ± SD, ng L−1) in the circulating water after the biofilter. An H2O2 solution was applied, with a dosage of 0–170 L d−1. PAA was applied to the inlet water 15 L d−1 (PAA1) and 4–6 L d−1 (PAA2) into the aeration system of the depuration tanks.
Figure 4. Concentrations of GSM and MIB (n = 4, ± SD, ng L−1) in the circulating water from the header tanks before entering the rearing tanks. An H2O2 solution was applied, with a dosage of 0–170 L d−1. PAA was applied to the inlet water 15 L d−1 (PAA1) and 4–6 L d−1 (PAA2) into the aeration system of the depuration tanks.
Table 1. Concentrations of GSM and MIB (ng L−1, n = 4, ± SD) in untreated inlet water from Lake Unnukka and in depuration tank water after 1 and 7 d
Figure 5. Concentrations of GSM and MIB (n = 4, ± SD, ng L−1) in the circulating water after the rearing tanks. An H2O2 solution was applied with a dosage of 0–200 L d−1 to the circulating water (2500 L s−1) and ozone (O3) 0–50 L d−1 to the inlet water (32–33 L s−1).
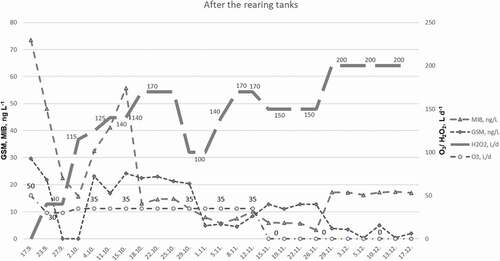
Table 2. Linear regression correlations between different H2O2 additions with GSM and MIB concentrations