
Figures & data
Figure 1. A Tri-level framework of inclusive work culture.
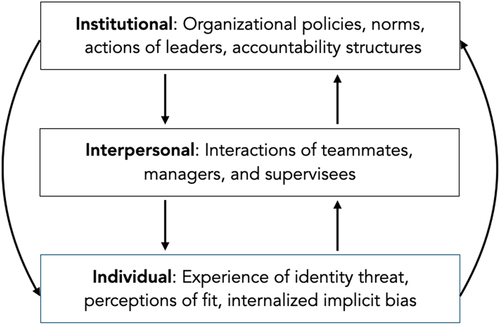
Figure 2. Mean anticipated social identity threat by participant gender and experimental condition. Data come from Hall et al. (Citation2018, Study 1). Error bars represent 95% confidence intervals.
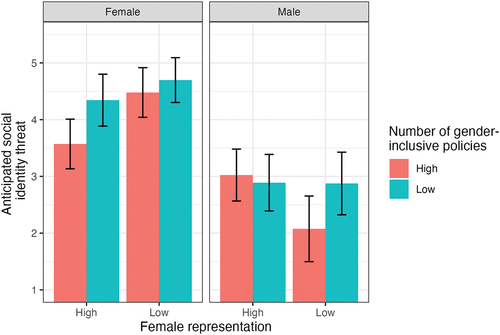
Figure 3. Mean anticipated positivity of conversations by participant gender and number of gender-inclusive policies. Data come from Hall et al. (Citation2018, Study 1). Error bars represent 95% confidence intervals.
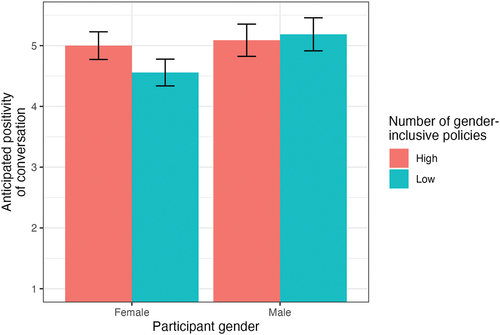
Table 1. Items assessing gender-inclusive policies and practices.
Figure 4. Indirect effect of increased policy support on increases in women’s commitment via increased value fit. Data come from Hall et al. (Citation2021). Reported coefficients are standardised betas.*p < .05. **p < .01. ***p < .001.
Figure 5. Simple slopes for daily social identity threat predicting daily burnout by participant gender. Data from a mega-analysis across the samples collected in Hall et al. (Citation2015) and Hall et al. (Citation2019; Samples 1 & 2).
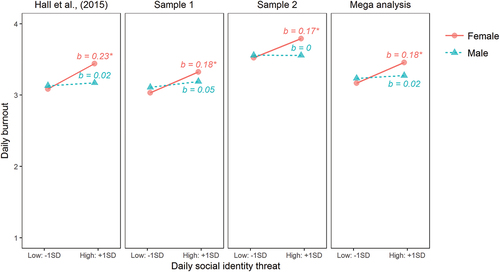
Figure 6. Simple slopes for conversational acceptance predicting daily social identity threat by participant and conversation partner gender. Data from a mega-analysis across the samples collected in Hall et al. (Citation2015) and Hall et al. (Citation2019; Samples 1 & 2).
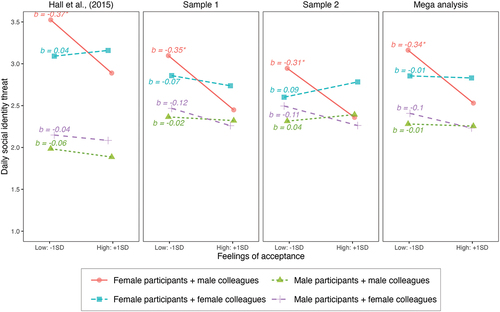
Figure 7. Implicit associations and participant gender predicting later organizational commitment.
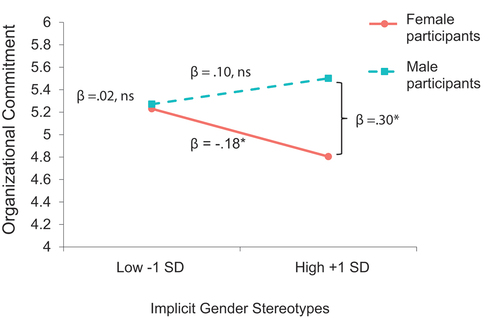
Table 2. A partial list of practical advice for translating our theoretical approach into action.