Figures & data
Table 1. Overview of the eight sections, the sources, and three open science principles of preregistration, open data, and open materials.
Figure 1. Predicted (standardized) judgments as a function of standard position on the given judgment dimension. Grey shaded area indicates assimilation effects.
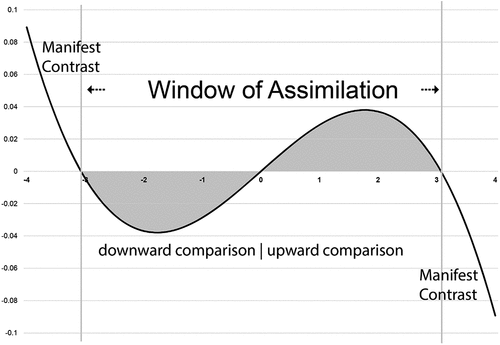
Figure 2. Estimated intercept adjusted standardised judgements of neutral faces as a function of position on judgement dimension of faces serving as comparison standards for three judgement dimensions (Studie 1a to 1c; Barker & Imhoff, Citation2021).
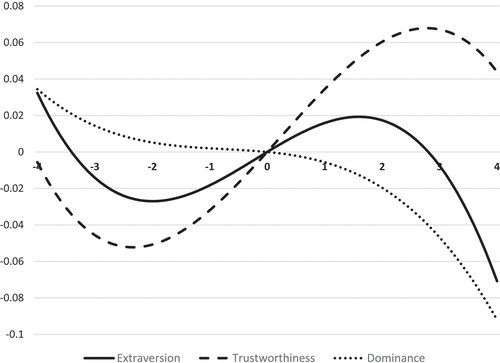
Figure 3. Illustrating the evaluative consequences of searching for similarities vs. differences, given the ecological properties of positive information’s relatively higher frequency (i.e., more filled boxes) and lower diversity (fewer boxes overall). White boxes represent potential attributes; filled boxes represent present attributes. The evaluative outcome depends on the cognitive comparison process applied to these two valence vectors. The bottom row shows the positive:negative ratio.
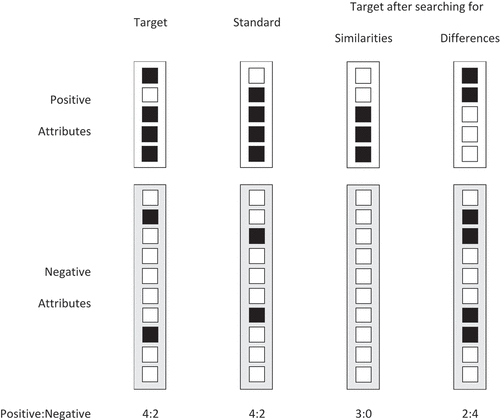
Figure 4. Searching for similarities (shared attributes) makes targets more positive. The left panel shows the probability of generating a positive attribute when participants searched for similarities (i.e., shared attributes), differences (i.e., unshared attributes), and the probability without instructions (i.e., natural search). The right panel shows the average rated likeability based on the attributes generated in the shared, natural, and unshared conditions (ratings on a 7-point scale). The error bars show the standard error of the means.
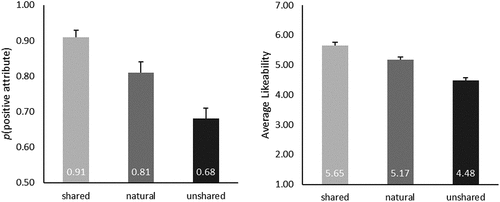
Figure 5. Probability to generate a positive attribute when participants searched for similarities (i.e., shared attributes) or differences (i.e., unshared attributes) in a positive ecology (i.e., liked targets/politicians) or in a negative ecology (i.e., disliked targets/politicians). The error bars show the standard error of the means.
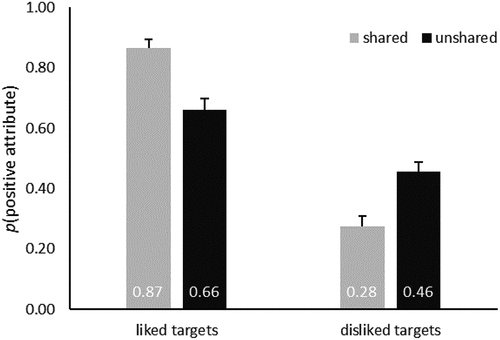
Figure 6. Average likeability rating for compatible and incompatible stimulus displays in Gerten and Topolinski’s (Citation2020) Experiments 1 to 4. Participants performed ratings on a 10-point rating scale. The error bars show the standard errors of the means. The difference is significant in Experiments 1, 2, and 4 (Cohen’s effect size measure for within-subjects designs dz = 0.19, 0.15, and 0.16, respectively).
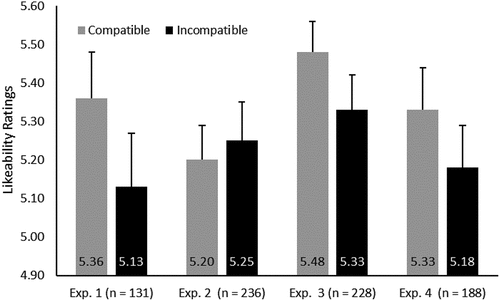
Figure 7. Example stimuli from Schneider and Mattes (Citation2022). The left picture depicts a stimulus pair in the close (proximal) condition. The right picture shows the same stimulus pair in the far (distant) condition. Figure adapted from Schneider and Mattes (Citation2022).
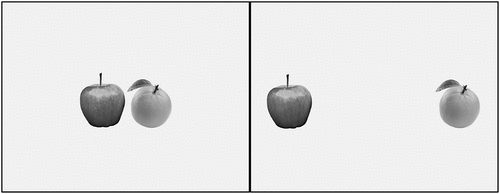
Figure 8. Results of Experiments 1A (left), 1B (centre), and 2 (right) from Schneider and Mattes (Citation2022) illustrating the relation between spatial distance and object categorisation. Spatially close stimuli are more likely to be categorised in a common superordinate group than spatially far stimuli, but only if they are sufficiently prototypical. Experiments 1A and 1B display the use of superordinate categories (in percentages) for close (proximal) and far (distant) stimulus pairs. Experiment 2 displays the mean rating for distant and proximal stimulus pairs, with higher rating scores indicating the tendency towards the superordinate category and lower rating scores indicating the tendency towards the basic category. Error bars represent the standard errors of the means.
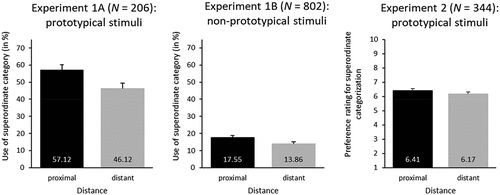
Table 2. Mapping of key motives from social comparison literature to motivational states in self-regulation research.
Figure 9. Multilevel regression predictions of the three motivational tendencies of pushing, disengagement, and coasting, measured on a scale from 1 to 5, as a function of comparison direction (x-axis), measured on a scale from extremely downward (−5) to extremely upward (+5). Ribbons around regression lines indicate the standard error of prediction.
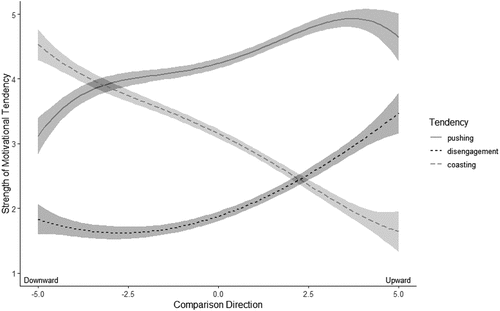
Figure 10. Trial structure of the imitation-inhibition task (Brass et al., Citation2000). In the congruent trials, the required response matches the observed response. In the incongruent trials, the required response does not match the observed response, and participants must suppress the automatic imitation behaviour.
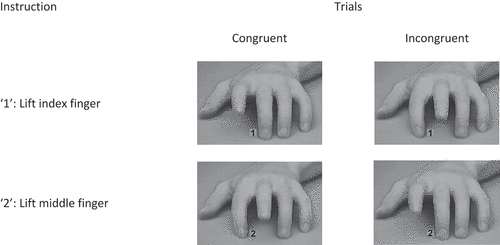
Figure 11. Internal meta-analysis for the difference in automatic imitation between in- and out-group members of Genschow, Cracco, et al. (Citation2021)’s experiments. Sample demographics after exclusions were Exp. 1 (43.4% female; Mage = 37.54; SDage = 11.98), Exp. 2 (38.8% female; Mage = 35.19; SDage = 11.25), Exp. 3 (41.1% female; Mage = 39.52; SDage = 11.22), Exp. 4 (33.3% female; Mage = 35.13; SDage = 9.37), Exp. 5 (37.66% female, Mage = 37.66; SDage = 11.25, and Exp. 6 (46.1% female; Mage = 28.03; SDage = 9.49). We conducted all experiments online.
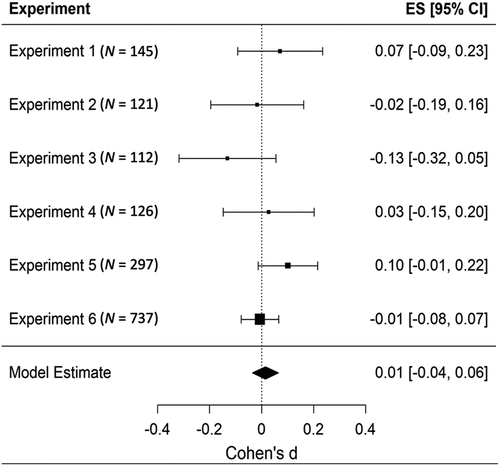
Table 3. Key differences between moral comparisons and comparisons in other domains.
Figure 12. Citizens of conservative states focus more on the past than citizens of liberal states. Data are dichotomised for illustration. On the left, dark-coloured states have a stronger relative frequency of Google search terms focused on the past, while light states focus more on the future. On the right, dark-coloured states have a Republican majority and light states a Democrat majority. Voting and Google searches correlate positively across states, r = .59, t(48) = 5.00, p < .001, 95% CI [.37; .74].
![Figure 12. Citizens of conservative states focus more on the past than citizens of liberal states. Data are dichotomised for illustration. On the left, dark-coloured states have a stronger relative frequency of Google search terms focused on the past, while light states focus more on the future. On the right, dark-coloured states have a Republican majority and light states a Democrat majority. Voting and Google searches correlate positively across states, r = .59, t(48) = 5.00, p < .001, 95% CI [.37; .74].](/cms/asset/e63f18e3-14d2-4073-8ed5-7c3fafe9eda8/pers_a_2161043_f0012_b.gif)
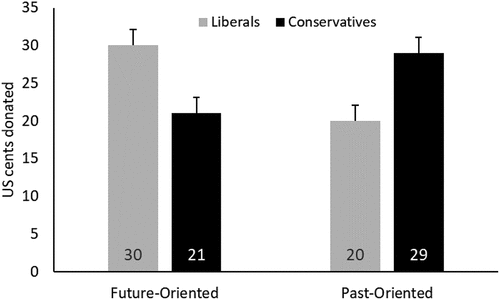
Figure 13. Participants' donation allocations as a function of the charities’ temporal comparison (Future vs. Past) and participants' self-reported ideology. Error bars represent standard errors of the means. Due to the nature of the allocation measure, the means are not independent, as they must add up to 50c. The statistical analysis took this point into account.
