2,624
Views
1
CrossRef citations to date
0
Altmetric
Articles

Morphological generalization in bilingual language production: Age of acquisition determines variability

ORCID Icon & ORCID Icon
Pages 370-386 | Received 25 Sep 2020, Accepted 22 Mar 2021, Published online: 13 May 2021

Figures & data

Table 1. Percentages of -t and -n participle overapplications in bilingual corpus data

Table 2. Percentages of -t and -n participle responses with and without stem change by Condition and Group

Table 3. Fixed effects from the model for -t (vs. -n) participle suffixation

Table 4. Fixed effects from the model for participles with (vs. without) stem changes

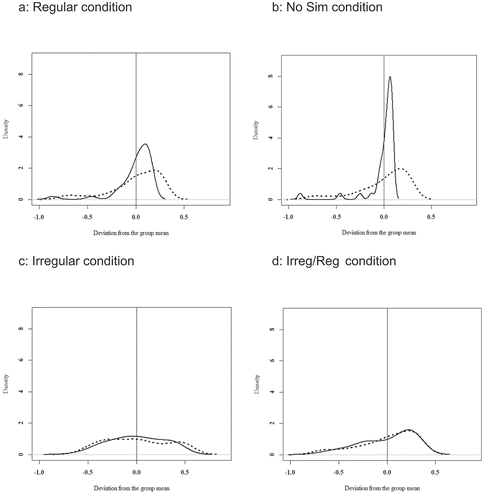
Figure 1. Density plots for -t participles (BIL: dotted line, CTR: straight line)

Figure 1. Density plots for -t participles (BIL: dotted line, CTR: straight line)

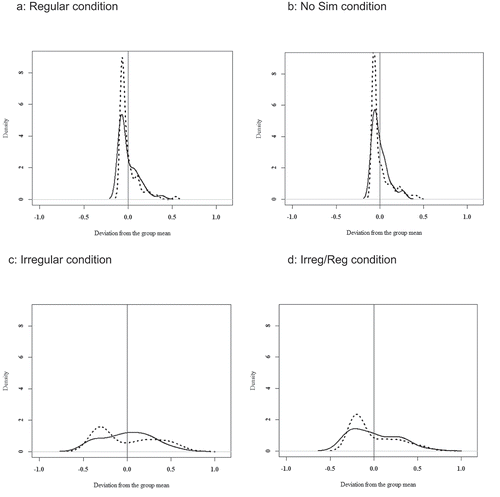
Figure 2. Density plots for participles with stem changes (BIL: dotted line, CTR: straight line)

Figure 2. Density plots for participles with stem changes (BIL: dotted line, CTR: straight line)

Table 5. Correlation coefficients (r) between participant-level variables

Figure 3. AoA by proportion of -t participles in the two participant groups: black straight line = BIL group, gray shadow = confidence intervals BIL; black dash-dotted line = model estimate for CTR group across the four conditions (=0.92), black dotted lines = confidence intervals CTR group (lower = 0.84; upper = 0.96)
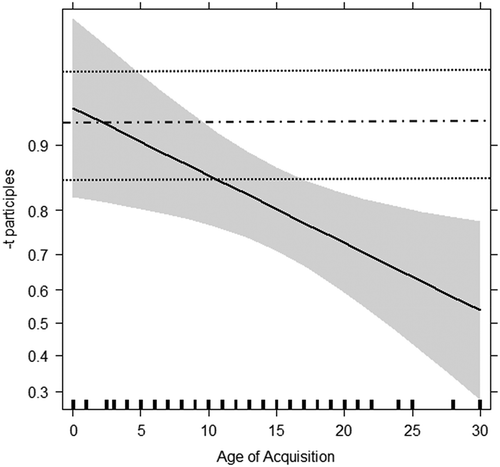
Figure 3. AoA by proportion of -t participles in the two participant groups: black straight line = BIL group, gray shadow = confidence intervals BIL; black dash-dotted line = model estimate for CTR group across the four conditions (=0.92), black dotted lines = confidence intervals CTR group (lower = 0.84; upper = 0.96)