
Figures & data
Table
Table
Figure 1. Example of pictures shown to participants.
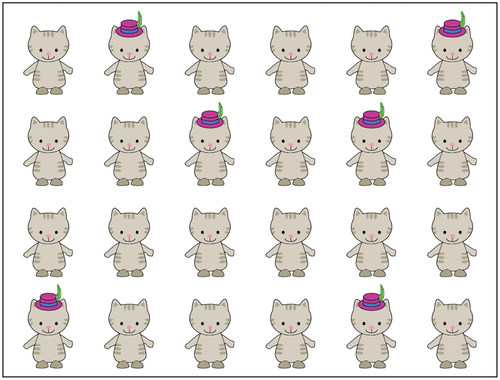
Figure 2. Pictures presented to participants. The fraction ‘x/24’ corresponds to the number of cats (out of 24) wearing hats.
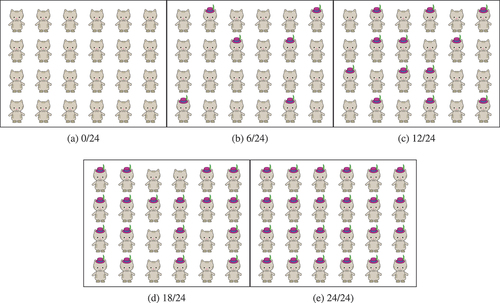
Table 1. The number of items per condition.
Table 2. The number and frequencies of the use of kein in each experimental context.
Table 3. The number and frequencies of the use of alle in each experimental context.
Table 4. Number of utterances in final dataset.
Figure 3. Rate of target determiner in subject role for both groups, when describing 24/24 or 0/24 pictures. The vertical bars reflect the standard error. Dots correspond to individual participants’ means. A horizontal jitter of 0.1 and vertical jitter of 0.025 were applied for better visualization.
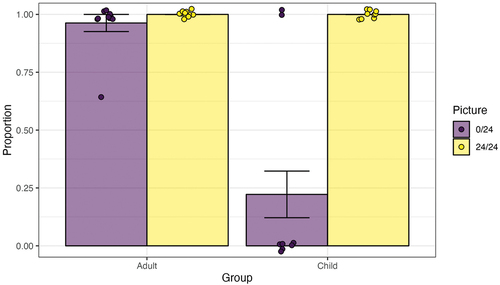
Table 5. Utterances that conveyed target meaning, contained target determiner, and where the grammatical role of this determiner was clear.
Table 6. Utterances produced by children to describe 0/24 pictures.
Figure 4. Negative indefinites in preverbal and postverbal position.
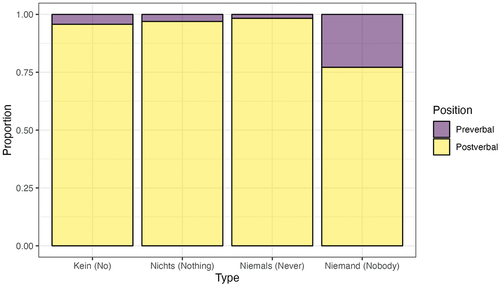
Table 7. Number and frequencies of negative indefinite types by position and results of the one-sample proportion z tests.
Figure 5. Negative indefinites used as subjects and objects.
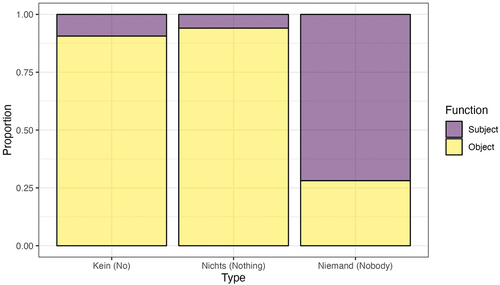
Table 8. Number and frequencies of negative indefinite types by grammatical function and results of the one sample proportion z tests.
Figure 6. Proportion of different determiners by position in Leo’s utterances.
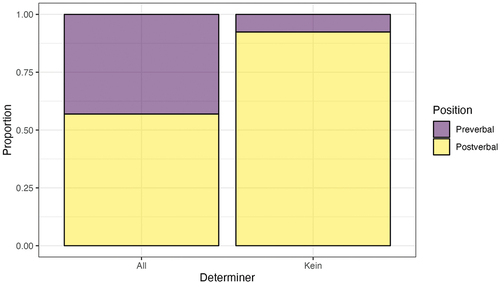
Figure 7. Proportion of different determiners by argument type in Leo’s utterances.
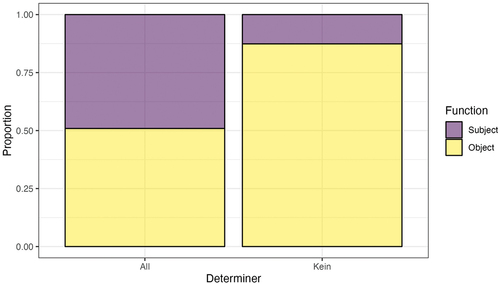
Figure 8. Proportion of different determiners by position in Leo’s and Leo’s mother’s utterances.
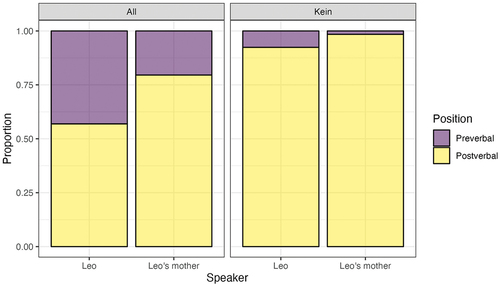
Figure 9. Proportion of different determiners by argument type in Leo’s and Leo’s mother’s utterances.
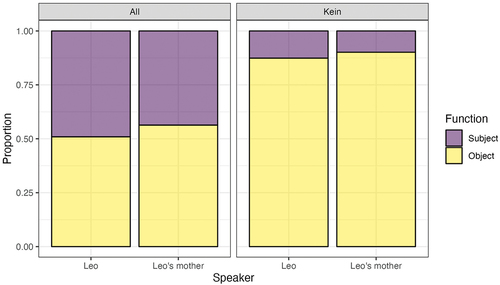
Figure 10: Layout of the screen that was presented to participants.
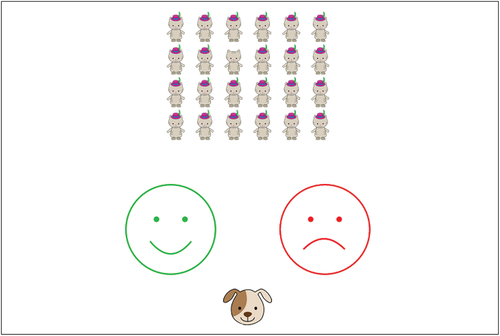
Figure 11. Pictures presented to participants. The fraction ‘x/24’ corresponds to the number of cats (out of 24) wearing hats.
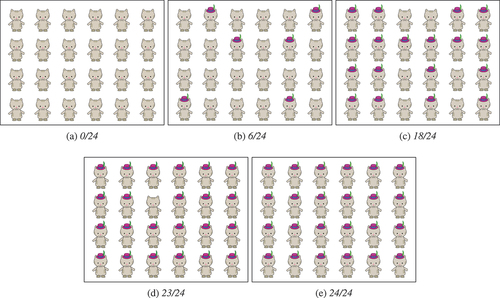
Table 9. Properties of the different items.
Figure 12. Response accuracy across control conditions. The vertical bars reflect the standard error. Dots correspond to individual participants’ means. A horizontal jitter of 0.1 and vertical jitter of 0.025 were applied for better visualization.
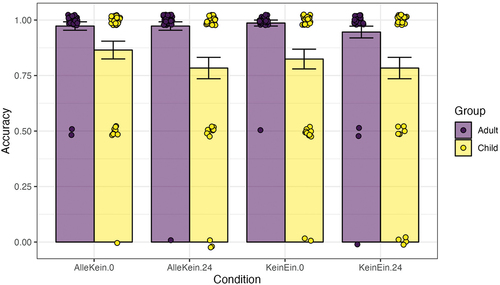
Table 10. Results of one-sample proportion z test.
Figure 13. Response accuracy across critical conditions. The vertical bars reflect the standard error. Dots correspond to individual participants’ means. A horizontal jitter of 0.1 and vertical jitter of 0.025 were applied for better visualization.
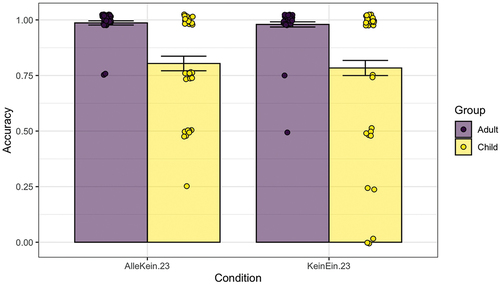
Figure 14. Raw response times across groups and critical conditions. The vertical bars reflect the standard error. Dots correspond to individual participants’ means. A horizontal jitter of 0.1 and vertical jitter of 0.025 were applied for better visualization.
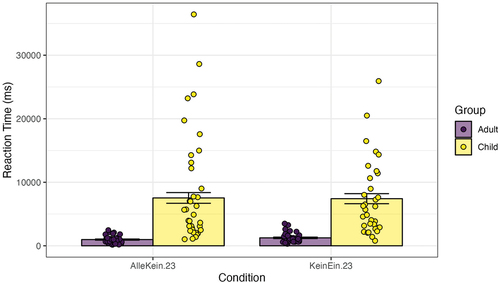
Figure 15. Logarithmically transformed response times across groups and critical conditions. The vertical bars reflect the standard error. Dots correspond to individual participants’ means. A horizontal jitter of 0.1 and vertical jitter of 0.025 were applied for better visualization.
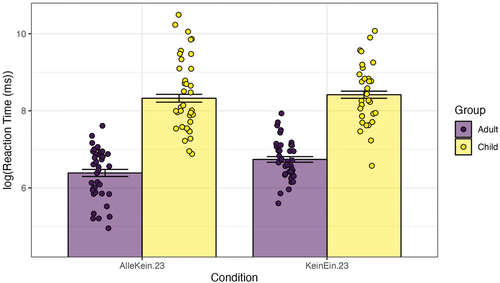
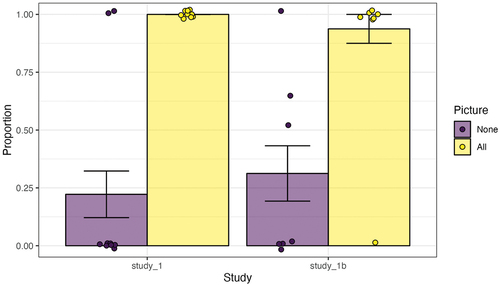
Figure 16. Comparison of the rates at which children produced utterances with the target determiner in subject role between Study 1 and the follow-up Study 1b. The vertical bars reflect the standard error. Dots correspond to individual participants’ means. A horizontal jitter of 0.1 and vertical jitter of 0.025 were applied for better visualization.
Table
Table
Table
Data Availability
All data and statistical analysis scripts are available at: https://doi.org/10.5281/zenodo.11235919