Figures & data
Table 1. Summary of the aspects under study in related work on educational escape rooms.
Figure 1. Screenshot of Puzzle 3 on the web application, which required students to program the code to display the different parts of the bomb on the web application and deactivate them in the right order by following one of the clues available to them.
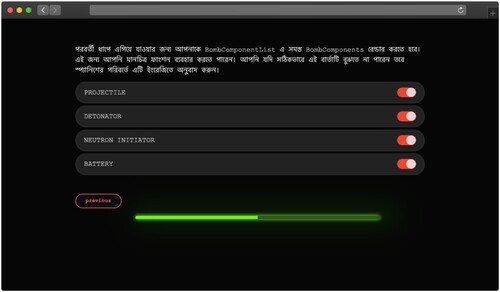
Table 2. Summary of the puzzles of the educational escape room.
Table 3. Logs of students' interactions during the escape room extracted from Escapp.
Figure 2. Example of a sequence built from the students' data.
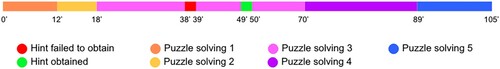
Figure 3. Sequence distribution plot (left) and index plot (right) of teams' actions during the educational escape room.
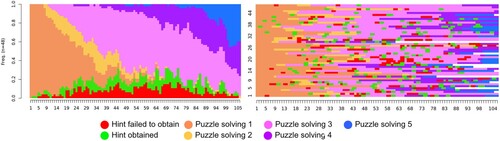
Figure 4. Sequence distribution plot (left) and index plot (right) of the actions of each cluster of teams during the educational escape room.
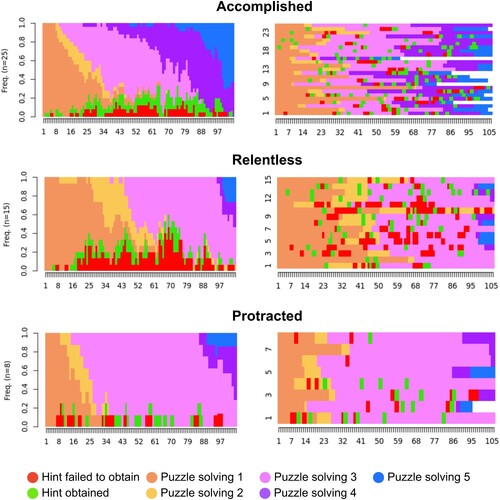
Figure 5. Violin plot comparing the success in obtaining hints among the three identified groups (for those teams who requested hints).
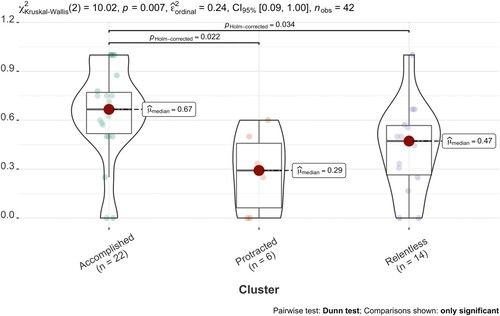
Figure 6. Violin plot comparing the scores between the pre-test and the post-test for the three identified groups.
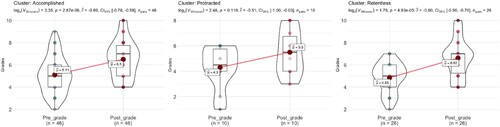
Figure A1. Violin plot comparing the scores of the pre-test among the three identified groups.
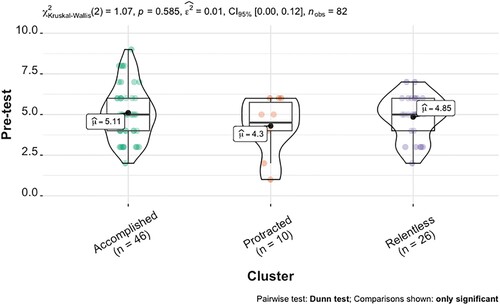
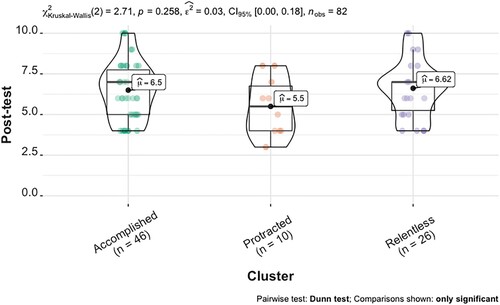
Figure A2. Violin plot comparing the scores of the post-test among the three identified groups.