Figures & data
Figure 1. Comparison between Question-based Learning (QBL), and Pure Question-based Learning (pQBL) in terms of the sequencing of and focus on different learning activities.
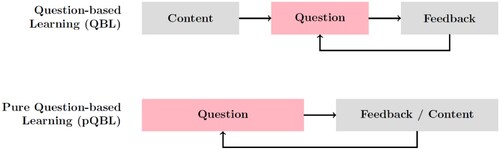
Table 1. Results of varying the arbitrary boundary between poor and good skills.
Figure 2. The probability distribution d(D) over the difference in quality D between the two versions of the learning module. The dashed lines denote the bounds of what difference we consider to be of practical significance.
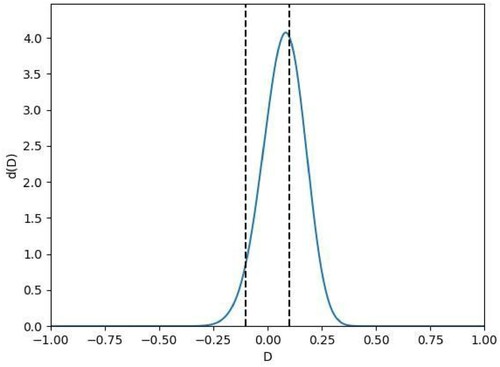
Figure A1. Frequencies for the possible answers to the question “I understood the instructions”.
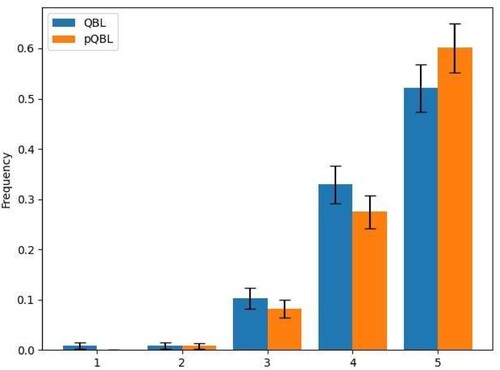
Figure A2. Frequencies for the possible answers to the question “I like internet-based learning”.
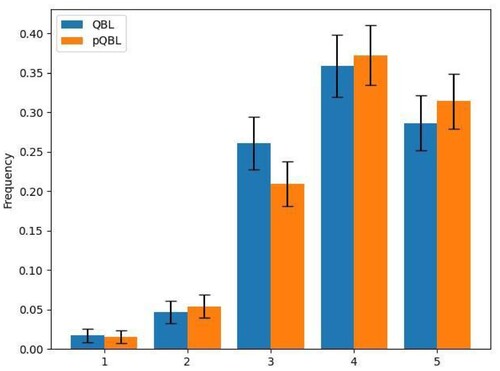
Figure A3. Frequencies for the possible answers to the question “The course was informative”.
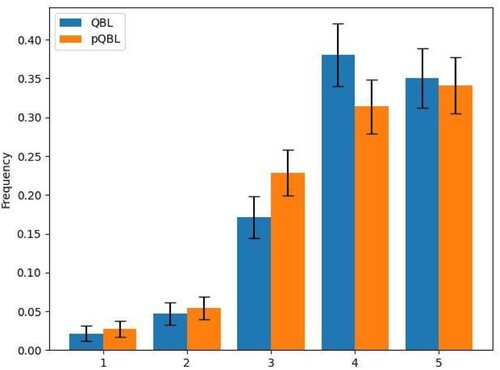
Figure A4. Frequencies for the possible answers to the question “The questions were of appropriate difficulty”.
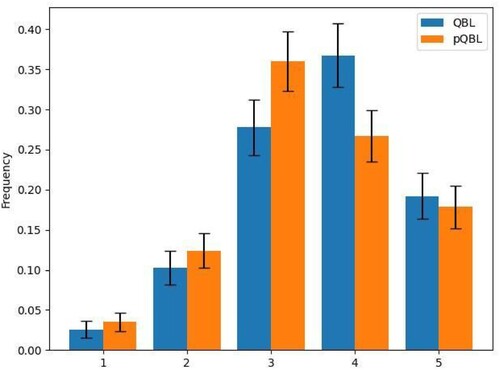
Figure A5. Frequencies for the possible answers to the question “The feedback in the questions was helpful”.
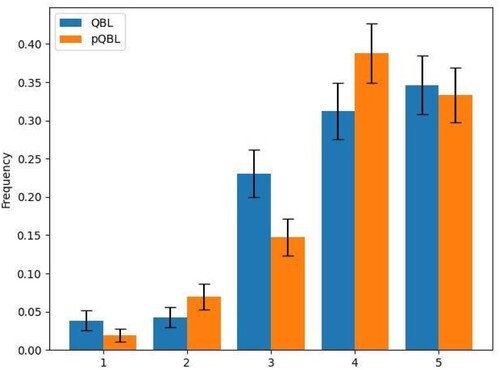
Figure A6. Frequencies for the possible answers to the question “The fact that the course was question-based helped me learn the material”.
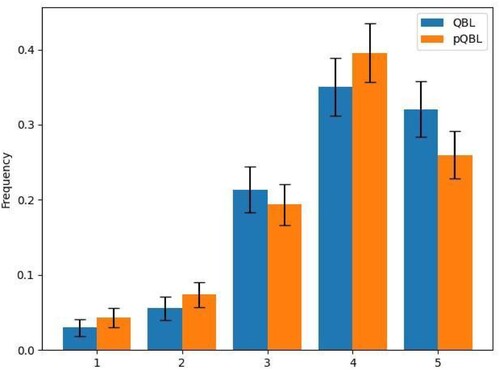
Figure A7. Frequencies for the possible answers to the question “The fact that the course was question-based motivated me”.
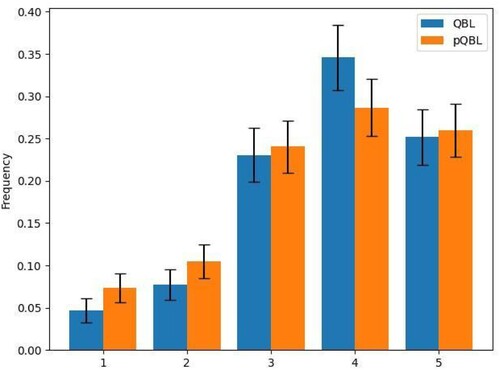
Figure A8. Frequencies for the possible answers to the question “If I take an online course in the future, I hope it is question-based”.
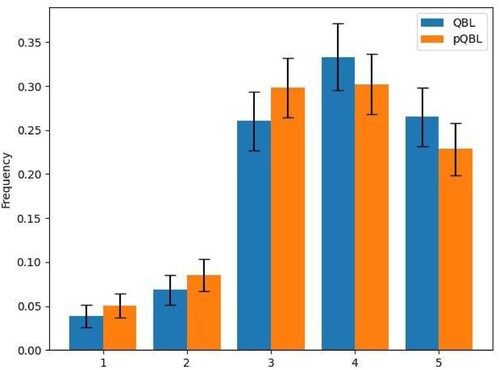
Figure A9. Frequencies for the possible answers to the question “I looked for the correct answer (e.g. on the internet) before answering the questions”.
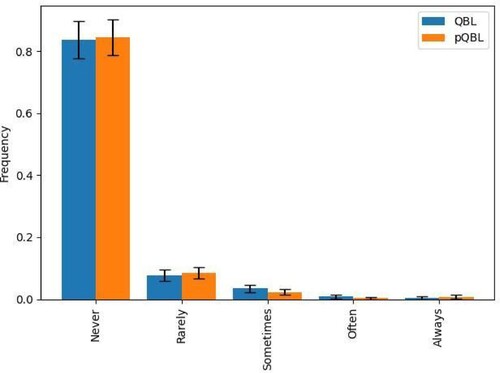
Figure A10. Frequencies for the possible answers to the question “I tried my best to answer the questions correctly on the first try”.
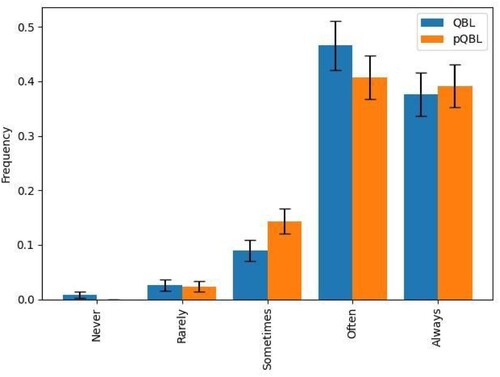
Figure A11. Frequencies for the possible answers to the question “After answering a question correctly, I continued to click on incorrect answers to get more feedback”.
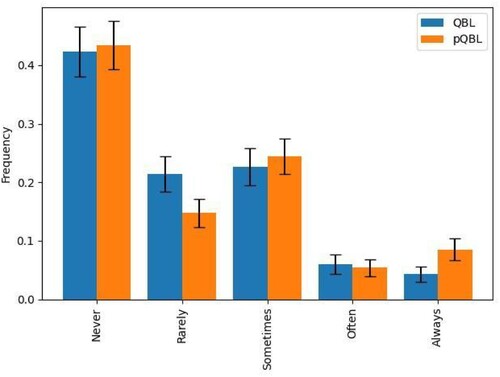
Figure A12. Frequencies for the possible answers to the question “How often did you feel frustrated during the course?”.
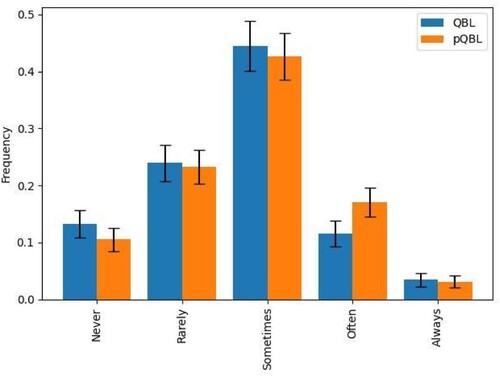
Figure A13. Frequencies for the possible answers to the question “Approximately how long did it take you to complete the course? Answer in minutes”, grouped by the nearest half-hour.
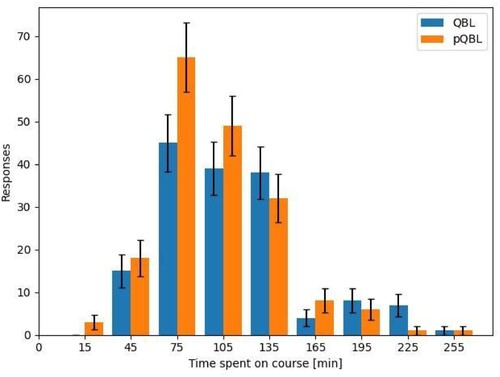
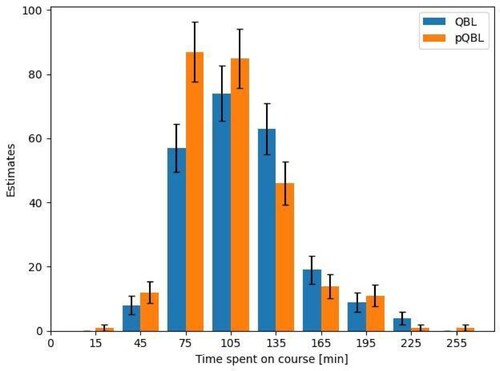
Figure A14. Our estimates of the time participants spent on the course, grouped by the nearest half-hour.