Figures & data
Table 1. Feed ingredients and nutrient composition of the basal diet, % as fed basis (air-dry basis).
Table 2. Primers used in real-time quantitative PCR.
Table 3. Effect of dietary GSPE supplementation on antioxidant enzyme activities and MDA content of finishing pigs.
Figure 1. Effects of GSPE on antioxidant enzyme genes in LD muscle and liver. (A) The mRNA expression of antioxidant enzyme genes in LD muscle. (B) The mRNA expression of antioxidant enzyme genes in liver. Data are presented as means and SEM (n = 6). *p < 0.05, **p < 0.01, and ***p < 0.001. SOD1: superoxide dismutase 1; SOD2 : superoxide dismutase 2; GR: glutathione reductase; CAT: catalase; GST: glutathione S-transferase.
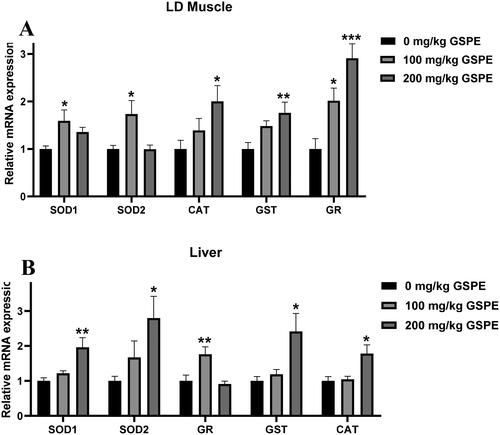
Figure 2. Effects of GSPE on expression of Nrf2 pathway genes. (A) NQO1, HO-1and Nrf2 protein levels in the liver were determined by Western blot analysis. (B) NQO1, HO-1and Nrf2 protein levels in LD muscle were determined by Western blot analysis. Equal loading was monitored with an anti-β-actin antibody. (C) NQO1, HO-1and Nrf2 mRNA levels in liver. (D) NQO1, HO-1and Nrf2 mRNA levels in LD muscle. Western blot analysis data are presented as means and SEM (n = 3). Real-time quantitative PCR data are presented as means and SEM (n = 6). *p < 0.05, **p < 0.01, and ***p < 0.001. NQO1: NAD(P)H, quinone oxidoreductase 1; Nrf2: NF-E2-related nuclear factor 2; HO-1: haem oxygenase-1.
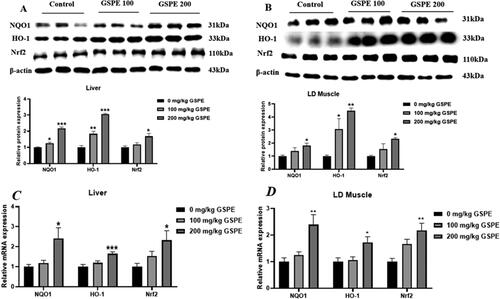
Table 4. Effect of dietary GSPE supplementation on serum lipid metabolism of finishing pigs.
Figure 3. Effects of GSPE on lipid metabolism gene expression in LD muscle and liver. (A) The mRNA expression of lipid metabolism genes in LD muscle, (B) The mRNA expression of lipid metabolism genes in liver. Data are presented as means and SEM (n = 6). *p < 0.05, **p < 0.01, and ***p < 0.001. CPT1a: carnitine palmitoyl-transferase-1a;CPT1b: carnitine palmitoyl transferase-1b; PPARα: peroxisome proliferator-activated receptor α; PPARγ: peroxisome proliferator-activated receptor γ; ACC: Acetyl-CoA carboxylase; HSL: hormone sensitive lipase; FAS: fatty acid synthase; PGC-1α: peroxisome proliferator-activated receptor gamma coactivator 1 alpha; Sirt1: sirtuin 1.
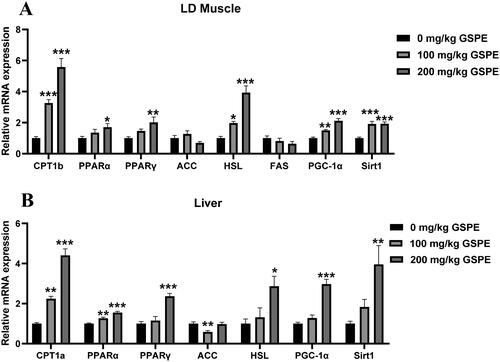
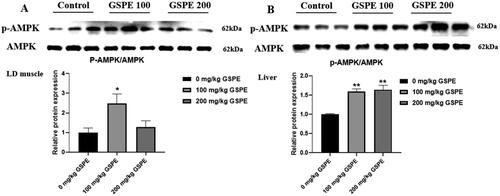
Figure 4. Effect of GSPE on p-AMPK expression in LD muscle and liver. (A) The p-AMPK protein expression in LD muscle. (B) The p-AMPK protein expression in liver. The p-AMPK protein level was monitored with AMPK protein. Data are presented as means and SEM (n = 3). *p < 0.05 and **p < 0.01. AMPK: AMP-activated protein kinase; p-AMPK: phospho-AMP-activated protein kinase.