
Figures & data
Table 1. Reverse transcription using reagents and the volume used.
Table 2. Primer sequences.
Table 3. qPCR reagent usage.
Table 4. Condition setting of qPCR.
Table 5. Summary of raw reads after quality control and Mapping to the reference genome.
Figure 1. (A) The distribution of lncRNAs and mRNAs in different chromosomes. (B) The length statistics of lncRNAs and mRNAs. (C) The statistics of lncRNAs and mRNAs exon number. (D) Classification of lncRNAs, including lincRNAs, intronic-lncRNAs, lncRNA and antisense_lncRNAs.
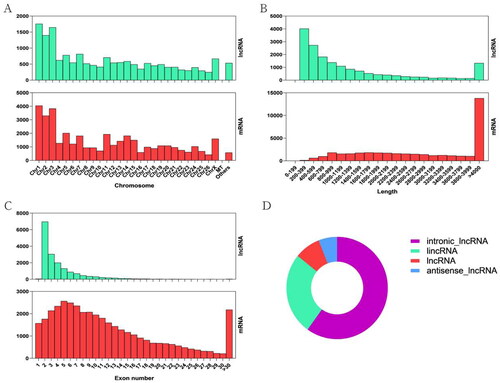
Figure 2. (A) Number of up-and down-regulated lncRNAs and mRNAs in the sheep thyroid between ww_FT and ww_LT. (B) Overlapping numbers of genes targeted by DELs and DEGs in ww_FT and ww_LT. 96 DELs (C) and 1054 DEGs (D) in ww_FT and ww_LT are shown in the heat map.
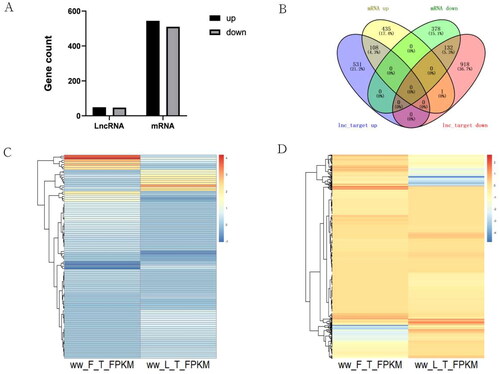
Figure 3. The top 30 enriched GO terms for the identified genes targeted by DELs (A) and DEGs (B) in ww_FT and ww_LT.
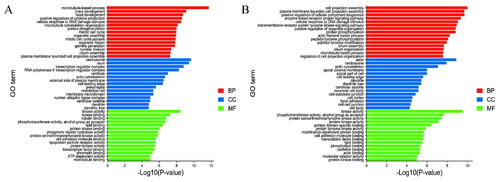
Figure 4. The 15 enriched KEGG pathways for the identified genes targeted by DELs (A) and DEGs (B) in ww_FT and ww_LT.
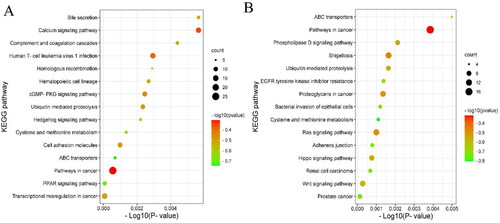
Figure 5. Co-expression of lncRNAs–mRNAs after genes targeted by DELs coincided with DEGs in ww_FT and ww_LT. Red (increased expression during the follicular phase) and green (decreased expression during the follicular phase) indicate up- or down-regulation, respectively.
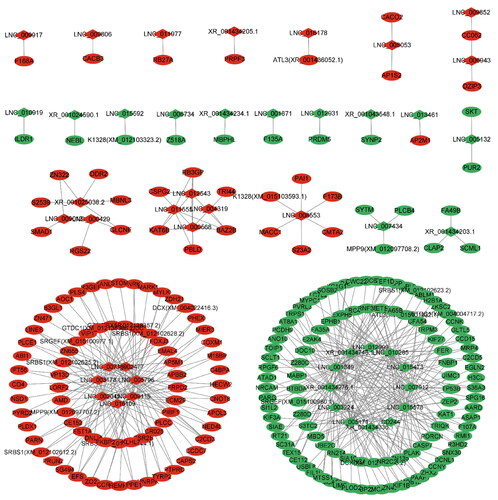
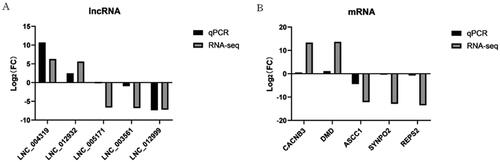
Figure 6. RT-qPCR validation of DELs (A) and DEGs (B) identified by RNA-seq in ww_FT and ww_LT (P < .05).
Supplemental Material
Download MS Excel (225 KB)Supplemental Material
Download MS Excel (26.5 KB)Supplemental Material
Download MS Excel (28 KB)Supplemental Material
Download MS Excel (397.5 KB)Supplemental Material
Download MS Excel (492 KB)Supplemental Material
Download MS Excel (893.5 KB)Supplemental Material
Download MS Excel (240 KB)Supplemental Material
Download MS Excel (39.5 KB)Supplemental Material
Download MS Excel (11.6 MB)Supplemental Material
Download MS Excel (3.2 MB)Supplemental Material
Download MS Word (11.6 KB)Data availability statement
Experimental animals in this study were authorized by the Science Research Department (in charge of animal welfare issues) of the Institute of Animal Science, Chinese Academy of Agricultural Sciences (IAS-CAAS; Beijing, China). Additionally, ethical approval of animal survival and the sample collection was given by the animal ethics committee of IAS-CAAS (No. IAS2019-49).