Figures & data
Table 1. Composition and nutrient levels of basal diet (DM basis).
Table 2. Primer sequences used for Real-time PCR.
Figure 1. Effects of tryptophan on liver Morphology in piglets after 4h lipopolysaccharide (LPS) challenge in piglets. (A) CONTR group, piglets were fed basal diet and injected with normal saline. Normal liver histology. (B) LPS group, piglets were fed a basal diet and injected intraperitoneally with LPS. Piglet liver showed significant pathological changes, including (a) heptatocyte caryolysis, (b) karyopycnosis, (c) inflammatory cell infiltration, hyperemia in hepatic sinusoids and hepatic cell cords arrangement in disorder were found. (C) Trp + LPS group, piglets were fed a basal diet supplemented with 0.2% tryptophan and injected intraperitoneally with LPS. n = 6 (1 pig/pen). original magnifications 400×. scale bars = 22.4 µm.
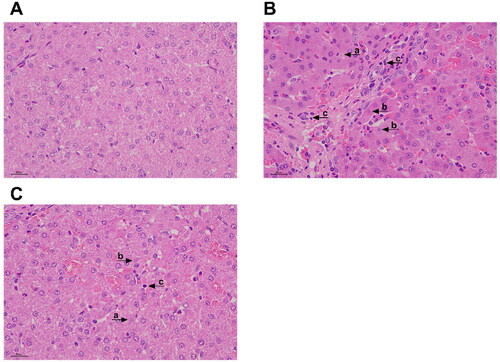
Figure 2. Tryptophan decreases serum alanine aminotransferase (ALT) and aspartate aminotransferase (AST) activities after 4h lipopolysaccharide (LPS) challenge in piglets. P values < 0.05 were considered significant. P values between 0.05 and 0.10 were regarded as a tendency. Values are presented as mean ± standard error, n = 6. CONTR: control group; LPS: piglets challenged with LPS; Trp + LPS: piglets fed with 0.2% tryptophan and challenged with LPS. * denotes P < 0.05, ** means P < 0.01.
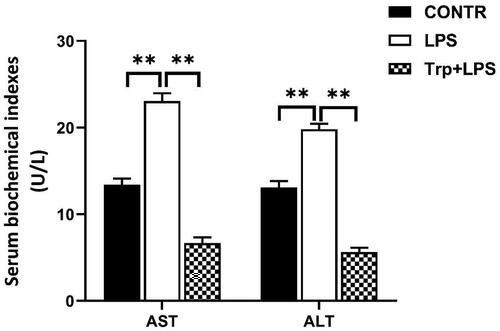
Figure 3. Effects of tryptophan on antioxidant indicators in the liver in piglets after 4h lipopolysaccharide (LPS) challenge in piglets. (A) the content of malondialdehyde (MDA). (B) the activity of glutathione peroxidase (GSH-Px). (C) the activity of catalase (CAT). (D) the activity of superoxide dismutase (T-SOD). (E) the content of hydrogen peroxide (H2O2). P values < 0.05 were considered significant. P values between 0.05 and 0.10 were regarded as a tendency. Values are showed as mean ± standard error, n = 6. CONTR: control group; LPS: piglets challenged with LPS; Trp + LPS: piglets fed with 0.2% tryptophan and challenged with LPS. *denotes P < 0.05, **means P < 0.01.
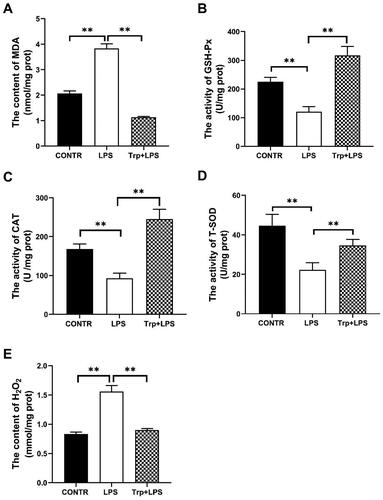
Figure 4. Effects of tryptophan on content and mRNA expression of liver pro-inflammatory cytokines in piglets after 4h lipopolysaccharide (LPS) challenge in piglets. (A) the content of liver pro-inflammatory cytokines (n = 5). (B) mRNA expression of liver pro-inflammatory cytokines (n = 6). P values < 0.05 were considered significant. P values between 0.05 and 0.10 were regarded as a tendency. Values are showed as mean ± standard error. CONTR: control group; LPS: piglets challenged with LPS; Trp + LPS: piglets fed with 0.2% tryptophan and challenged with LPS. TNF-α: tumor necrosis factor-α. IL-1β: interleukin-1 β. * denotes P < 0.05, ** means P < 0.01.
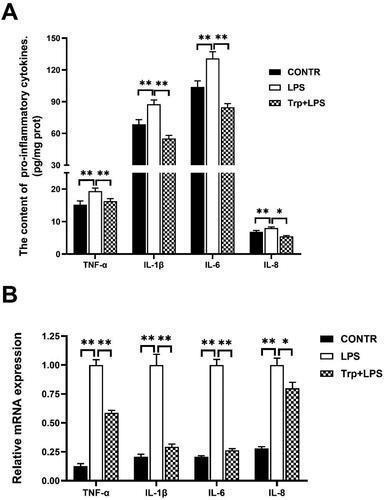
Figure 5. Effects of tryptophan on mRNA expressions of tight junction (A), HSP70 gene (B), necroptosis (C), and pyroptosis (D) in liver after 4h lipopolysaccharide (LPS) challenge in piglets. P values < 0.05 were considered significant. P values between 0.05 and 0.10 were regarded as a tendency. Values are showed as mean ± standard error, n = 6. CONTR: control group; LPS: piglets challenged with LPS; Trp + LPS: piglets fed with 0.2% tryptophan and challenged with LPS. NLRP3: NOD-like receptor family pyrin domain containing 3. ASC: apoptosis-associated speck-like protein containing a CARD. GSDMD: gasdermin-D. ZO-1: zonula occludens-1. RIP1: the kinases receptor-interacting protein 1. RIP3: the kinases receptor-interacting 3. MLKL: the mixed lineage kinase domain-like protein. FADD: fas-associated death domain. PGAM5: phosphoglycerate mutase 5. HSP70: the 70-kDa heat shock proteins. * denotes P < 0.05, ** means P < 0.01.
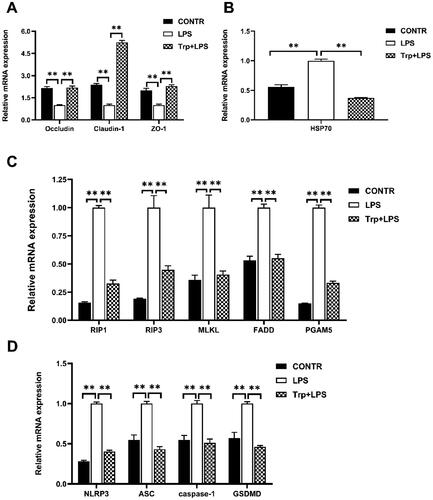
Figure 6. Effects of tryptophan on protein expressions of tight junction in liver after 4h lipopolysaccharide (LPS) challenge in piglets. P values < 0.05 were regarded as significant. P values between 0.05 and 0.10 were regarded as a tendency. Values are presented as mean ± standard error, n = 4. CONTR control group; LPS piglets challenged with LPS; Trp + LPS piglets fed with 0.2% tryptophan and challenged with LPS. ZO-1: zonula occludens-1. ns denotes not significant, * means P < 0.05, ** denotes P < 0.01.
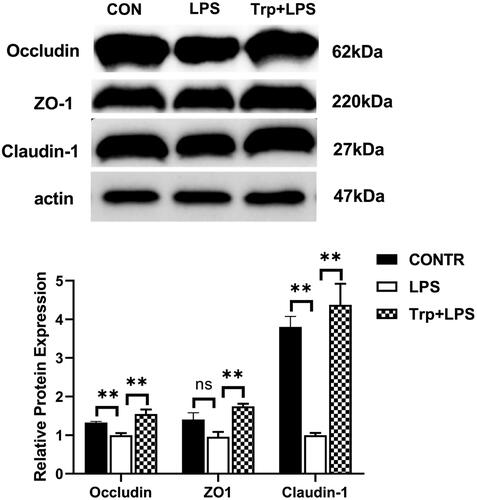
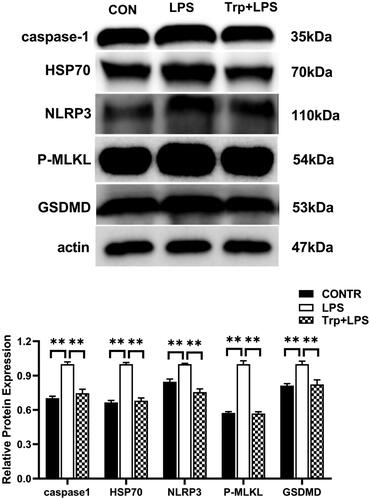
Figure 7. Effects of tryptophan on expression pyroptosis-related proteins in liver after 4h lipopolysaccharide (LPS) challenge in piglets. P values < 0.05 were considered significant. P values between 0.05 and 0.10 were regarded as a tendency. Values are presented as mean ± standard error, n = 4. CONTR: control group; LPS: piglets challenged with LPS; Trp + LPS: piglets fed with 0.2% tryptophan and challenged with LPS. NLRP3: NOD-like receptor family pyrin domain containing 3. GSDMD: gasdermin-D. MLKL: the mixed lineage kinase domain-like protein. HSP70: the 70-kDa heat shock proteins. * denotes P < 0.05, ** means P < 0.01.