
Figures & data
Table 1. Enrichment analysis based on genes differentially expressed in the mammary gland between cows with high and low breeding values for milk urea.
Figure 1. Expression profiling and enrichment analysis of key molecular features in liver, kidney and mammary gland discriminating HMUg and LMUg cows. The tissue-specific expression of the selected genes and the hierarchical clustering of the samples are illustrated in a heatmap (A). The color key represents the Z-score indicating the level of gene expression. The circos plot (B) indicates the key genes in each tissue (yellow: mammary gland, brown: liver and grey: kidney), their correlations greater than 0.7 (inner circle) and the predominant expression of genes in HMUg and LMUg group (outer circle). The enrichment plot (C) shows the significantly enriched GO terms (GO:BP) and pathways (IPA and KEGG) based on the 147 genes.
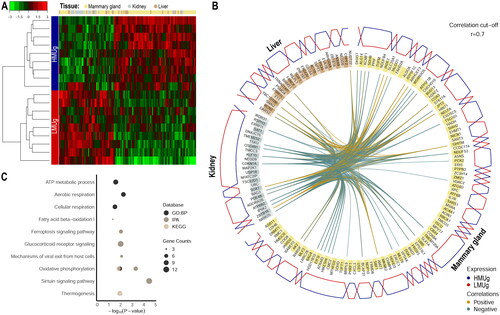
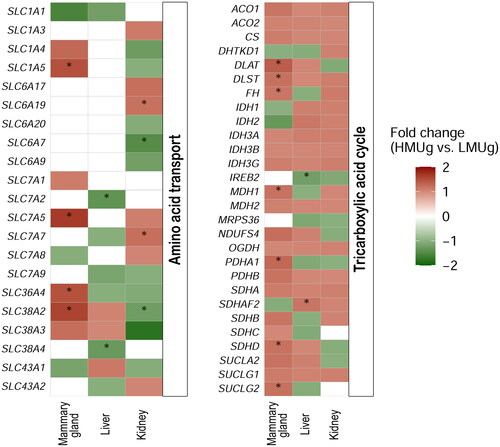
Figure 2. Genes related to amino acid transport and the TCA cycle and their differential expression in the mammary gland, liver and kidney between cows with high and low breeding values for MU. The colors reflect the fold change in expression levels between HMUg and LMUg cows. Asterisks indicate the significance of the results (p value < 0.05). White fields are indicating the absence of expression in the corresponding context.
Supplemental Material
Download MS Excel (1.9 MB)Data availability statement
The data that support the findings of this study are available from the corresponding author [KW] upon reasonable request.