
Figures & data
Table 1. Ingredient and chemical composition of piglet diets, as-fed basis.
Table 2. The growth performance in piglet.Table Footnotea
Table 3. Effect of vitamin B5 on intestinal organ indices.Table Footnotea
Table 4. Effects of vitamin B5 on intestinal morphology.Table Footnotea
Figure 1. Intestinal morphological structure and immunohistochemical analysis of weaned piglets fed with different dietary concentrations of VB5 (magnification 100×). (A) ileum morphology. (B) Colon morphology. (C) Cecum morphology. (D) Immunohistochemistry staining with a Ki67 antibody in the colon. (E) Immunohistochemistry staining with a Ki67 antibody in the cecum. (F) Alcian blue-periodic acid-shiff staining in the colon. (G)Immunohistochemistry of the ileum. (H) Immunohistochemistry of the cecum. (I) Immunohistochemistry of the colon. n = 7. *p < .05, **p < .01, ***p < .001.
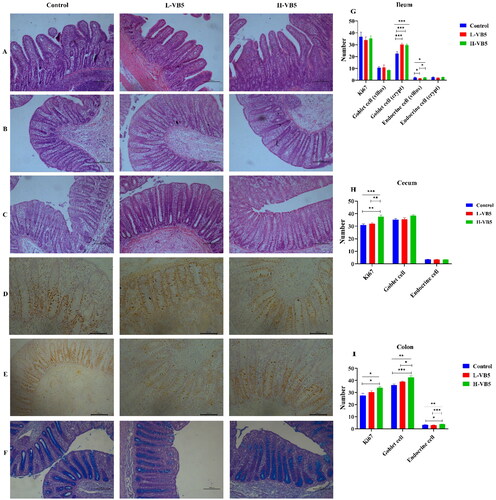
Figure 2. Effect of vitamin B5 on the composition of colonic bacterial. (A) NMDS plot of functional profiles among groups. (B) PCoA plot of functional profiles among groups. (C) Colon bacterial communities at the genus level. (D) Colonic differential bacteria at the genus level. n = 7. *p < .05, **p < .01, ***p < .001.
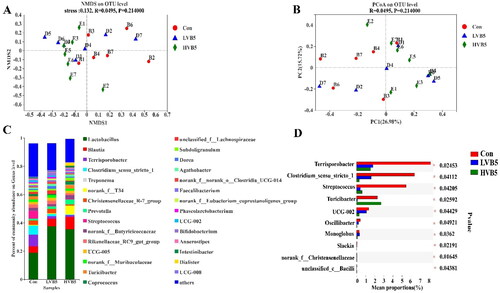
Table 5. Alpha diversity index.Table Footnotea
Figure 3. Abundances of KEGG pathways in the functional prediction by Tax4Fun. (A) Prediction of colonic microbial function. (B) Metabolic function annotation map. (C) and (D) Amino acid metabolism. n = 7. *p < .05, **p < .01, ***p < .001.
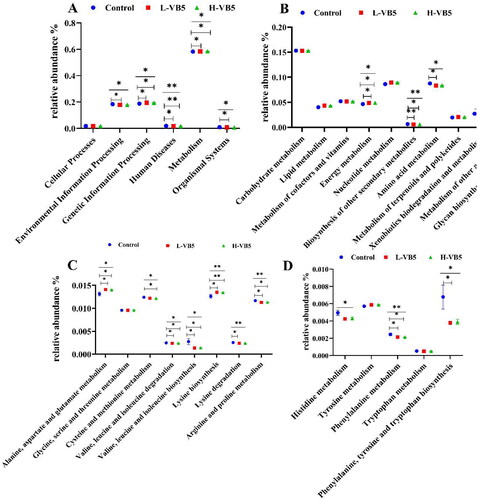
Figure 4. Spearman correlation analysis of gut morphology and microbes (genus level). *p < .05, **p < .01, ***p < .001.
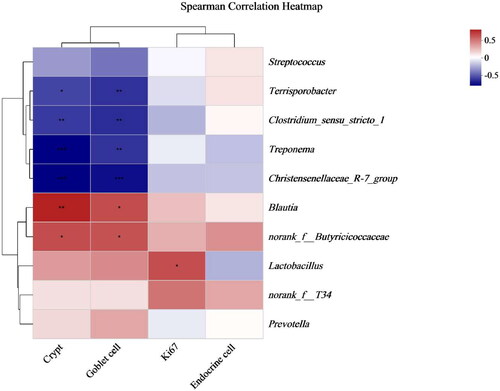
Table 6. Effect of VB5 on colonic SCFAs.Table Footnotea