
Figures & data
Table 1. List of primer sequences for determining relative mRNA expression levels of genes related to milk production.
Figure 1. Relative mRNA expression of genes involved in milk production following RNAi Treatment.
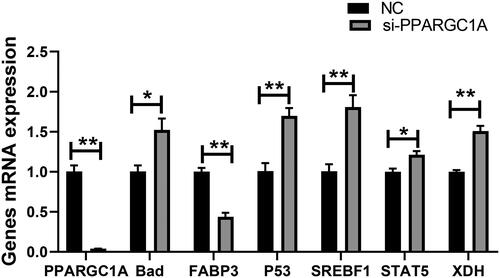
Figure 2. Effect of PPARGC1A gene knockdown on the cell cycle of BuMECs. (A) (NC), and (B) (si-PPARG1A) cell cycle distribution; (C) flow cytometry to detect cell cycle progression.
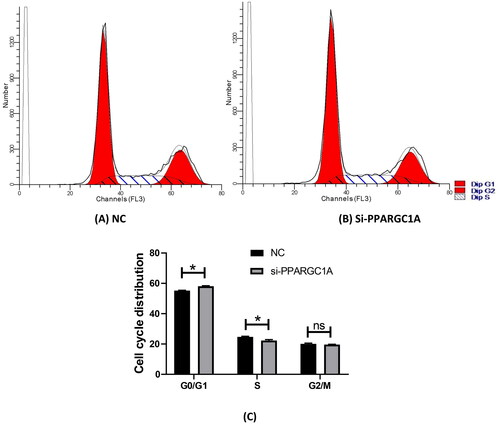
Figure 3. Impact of PPARGC1A gene knockdown on BuMEC viability.
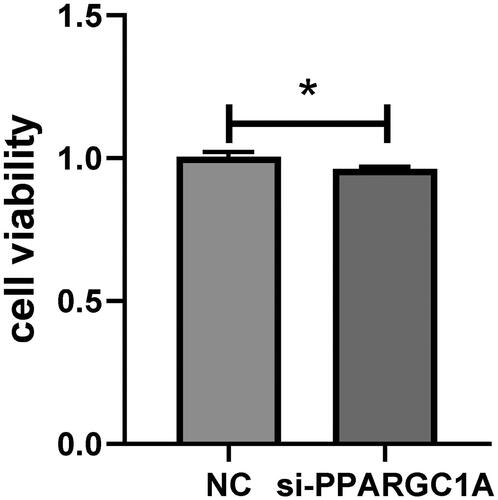
Figure 4. Number of living cells in control and PPARGC1A gene knockdown groups.
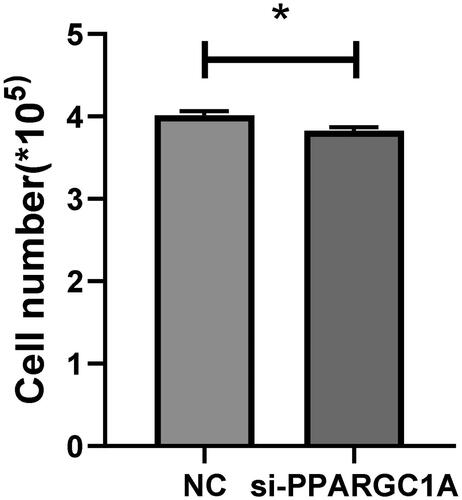
Figure 5. Effect of PPARGC1A gene knockdown on apoptosis in BuMECs. (A) (NC), and (B) (si-PPARGC1A) cell apoptosis distribution; (C) the rates of early, late, and total apoptosis
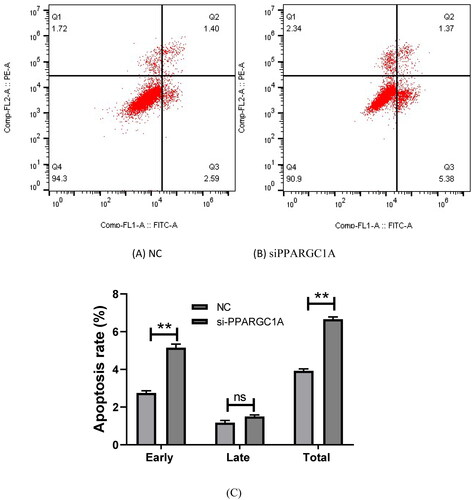
Figure 6. Effect of PPARGC1A gene on medium and long-chain fatty acids in BuMECs following RNAi Treatment.
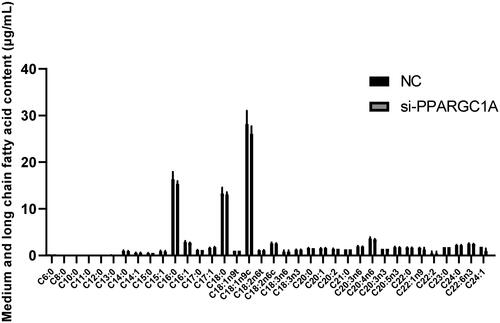
Figure 7. Impact of PPARGC1A gene knockdown on triglyceride secretion in BuMECs.
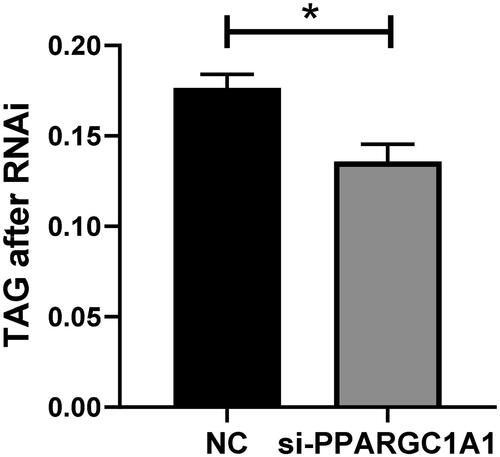
Figure 8. Impact of PPARGC1A gene knockdown on β-casein levels in BuMECs.
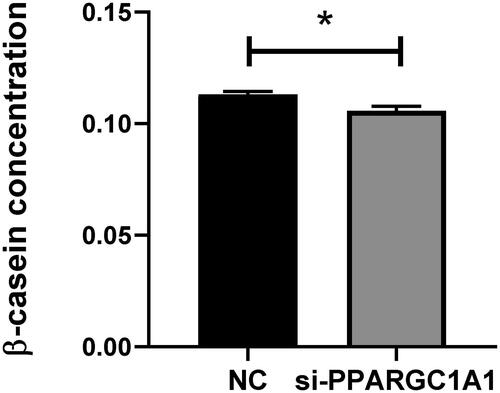
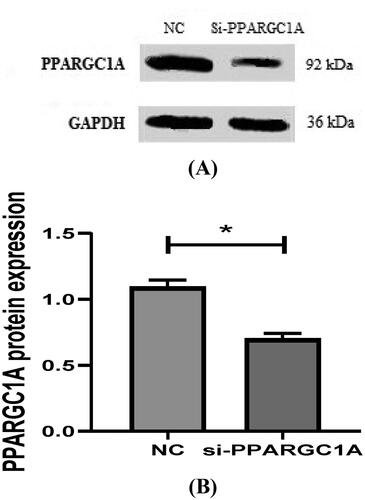
Figure 9. (A, And B) detection of protein expression of PPARGC1A gene in BuMECs after RNAi.
Data availability statement
The data used to support the findings of this study are included in the article.