Figures & data
Figure 1. The proliferation and differentiation properties of pMuSCs were inhibited by the addition of RA.
A: Representative pictures showing the EdU assay in 1μM RA-treated pMuSCs for 48 h, (Scale bars: 50 µm).
B: Quantification of EdU-positive pMuSCs in B. n= 3 independent assays/condition, >3000 cells counted/assay.
C: CCK8 assay result showing the effect of RA on pMuSCs proliferation compared to that of control cells treated with 0.1%DMSO.
D: The mRNA expression levels of KI67 and BAX after RA treatment in pMuSCs for 48 h.
E: MYHC staining of pMuSCs after addition of RA and induction of differentiation for 48 h (Scale bars: 50 µm).
F: Quantification of the differentiation index in E.
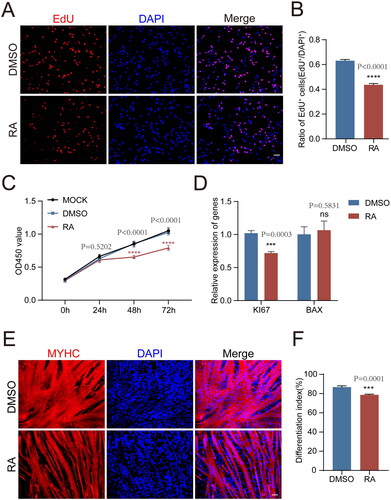
Figure 2. RA and RARγ further inhibited the proliferation and differentiation ability of pMuSCs.
A: The mRNA expression levels of RARγ after RA treatment in pMuSCs for 48 h.
B: The efficiency of RARγ overexpression in pMuSCs was detected by qPCR.
C: The mRNA expression levels of KI67 and BAX of RA-treated pMuSCs after overexpression RARγ for 48 h.
D: The proliferation ability of RA-treated pMuSCs was detected by EdU staining after overexpression RARγ for 48 h (Scale bars: 50 µm).
E: Quantification of EdU-positive pMuSCs. n= 3 independent assays/condition, >3000 cells counted/assay.
F: MYHC staining of RA-treated pMuSCs overexpressed the GFP and RARγ respectively and induced differentiation for 48 h (Scale bars: 50 µm).
G: Quantification of the fusion index in F.
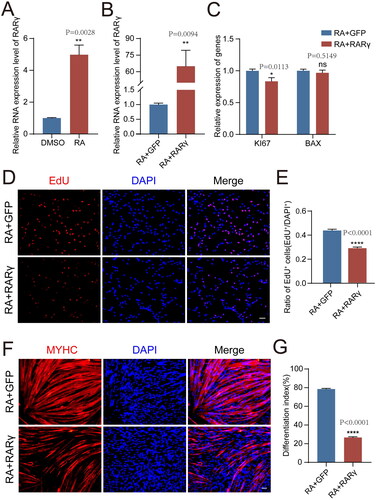
Figure 3. The RARγ signal which was activated by RA repressed MYOD protein translation in pMuSCs.
A: The mRNA expression levels of PAX7, MYOD and MYOG after different treatments, including DMSO + GFP, RA + GFP and RA + RARγ.
B: Western blot analysis of the protein expression levels for MYOD after different treatments, including DMSO + GFP, RA + GFP, RA5 + GFP and RA + RARγ. ACTB was used as the control. RA5 represents the treatment concentration of RA is 5 μM, RA represents the treatment concentration of RA is 1 μM.
C: Western blot analysis of the protein expression levels for PAX7 and MYOG after different treatments, including DMSO + GFP, RA + GFP and RA + RARγ. ACTB was used as the control.
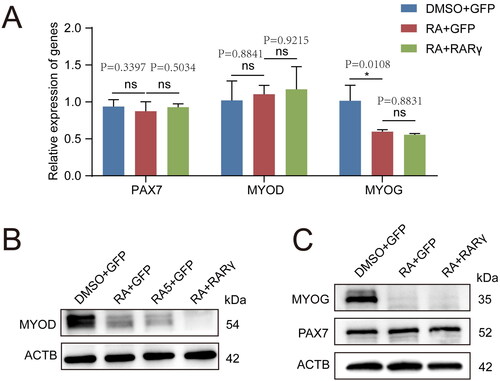
Figure 4. RARγ affects MYOD protein synthesis via the AKT/eIF4EBP1 signalling cascade.
A: Western blot analysis of protein levels of p-AKT, AKT, p-eIF4EBP1, eIF4EBP1 and ACTB after different treatments, including RA + GFP and RA + RARγ.
B: Western blot analysis of protein levels for MYOD in RA + RARγ group and RA + RARγ + SC79 group treated pMuSCs.
C: The EdU staining of RA + RARγ group and RA + RARγ + SC79 group treated pMuSCs (Scale bars: 50 µm).
D: Quantification of EdU-positive pMuSCs. n= 3 independent assays/condition, >3000 cells counted/assay.
E: MYHC staining of RA + RARγ group and RA + RARγ + SC79 group treated pMuSCs after induced differentiation for 48 h (Scale bars: 50 µm).
F: Quantification of the fusion index in E.
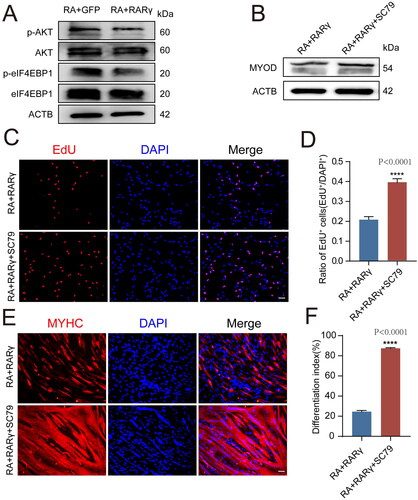
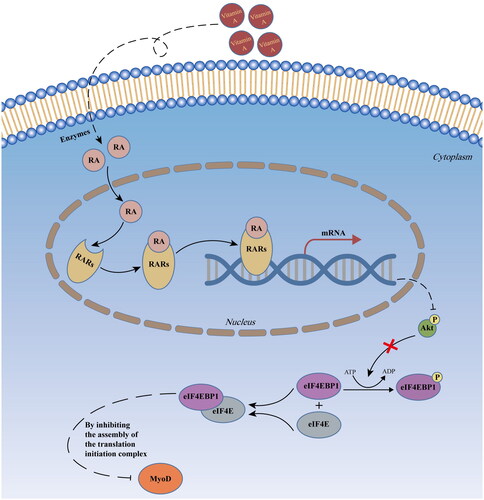
Figure 5. Schematic illustration of retinoic acid signaling inhibiting myogenesis by blocking MYOD translation in pig muscle stem cells.