Figures & data
Table 1. Attributes and description of the sensory attributes evaluated by the sensory panel. Descriptions are based on the Norwegian standard NS-ISO 5492.
Table 2. Chemical composition (g/kg dry matter), NaCl relative to ash (%), peptide size distribution (% of peptides) of fish solubles based on trimmings (Trim), heads, backbones, skin (HBS) and viscera from cod, haddock, saithe, and golden redfish.
Table 3. Levels of free amino acids and dipeptides (g/kg dry matter) in fish solubles based on trimmings (Trim), heads, backbones, skin (HBS), and viscera from cod, haddock, saithe, and golden redfish.
Table 4. Mean sensory intensity values of smells in fish solubles based on trimmings, heads, backbones, skin (HBS) and viscera from cod, haddock, saithe, and redfish. Different letters indicate statistical difference (p < .05) within each attribute based two-way mixed factorial model and Tukey’s post hoc test.
Table 5. Mean sensory intensity values of taste and flavor in fish solubles based on trimmings, heads, backbones, skin (HBS) and viscera from cod, haddock, saithe, and redfish. Different letters indicate statistical difference (p < 0.05) within each attribute based two-way mixed factorial model and Tukey’s post hoc test.
Figure 1. Mean intensity of smell sensory attributes for cod, haddock, saithe, and golden redfish (a) and trimmings, head-backbone-skin (HBS) and viscera (b). Different letters for each parameter within each attribute indicate significant differences (p < 0.05) based on ANOVA and Tukey’s post hoc test.
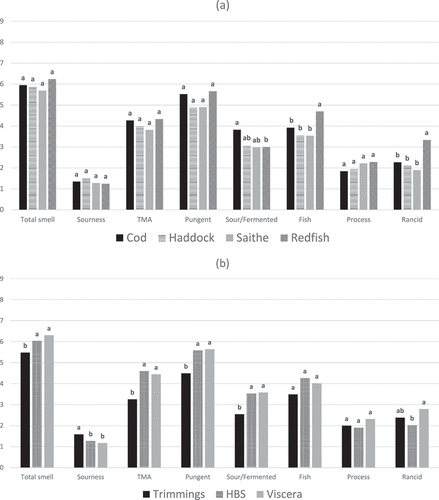
Figure 2. Mean intensity of taste and flavour sensory attributes for cod, haddock, saithe, and golden redfish (a) and trimmings, head-backbone-skin (HBS) and viscera (b). Different letters for each parameter within each attribute indicate significant differences (p < 0.05) based on ANOVA and Tukey’s post hoc test.
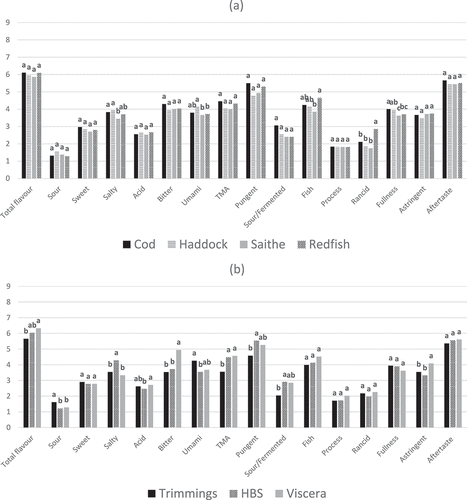
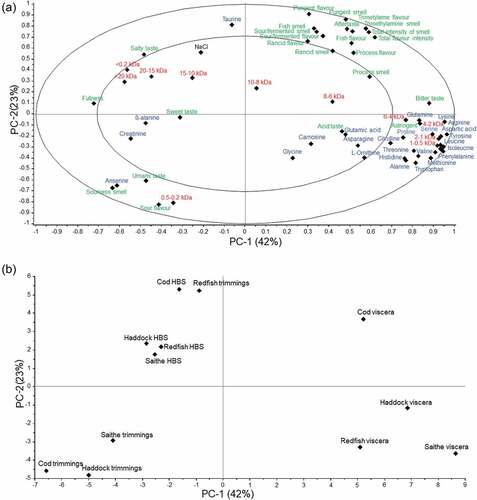
Figure 3. (a) Principal component analysis loading plot based on NaCl (black; ), peptide molecular weight distribution (red; ) distribution of free amino acids (blue; ) and sensory attributes (green; ). The two ellipses represent 50% and 100% of explained variance. (b) Principal component analysis score plot showing similarities and differences between the fish solubles based on cod, haddock, saithe and redfish trimmings, head-backbone-skin (HBS), and viscera.