Figures & data
Table I. Demographic data at baseline.
Table II. Observed means, standard deviations, and number of observations for outcome and processes over the treatment period.
Figure 1. Trajectory of change in depressive symptoms for patients experiencing SGs with 95% confidence intervals for all time points.
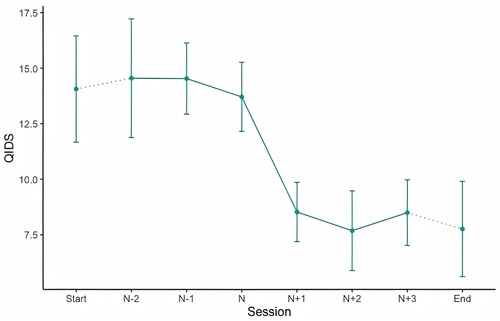
Figure 2. Trajectory of change in depressive symptoms for patients experiencing LIIs with 95% confidence intervals for all time points.
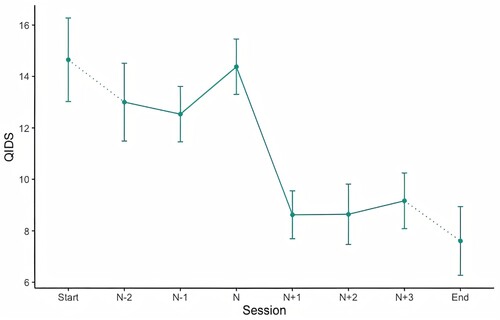
Figure 3. DERS-16 for patients experiencing SGs with 95% confidence intervals for all time points.
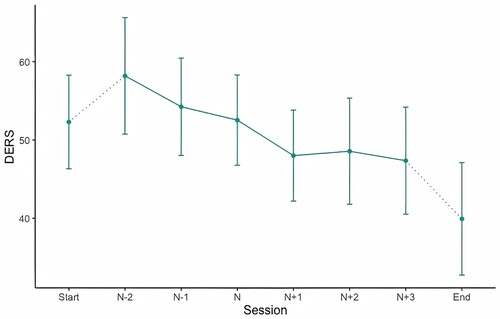
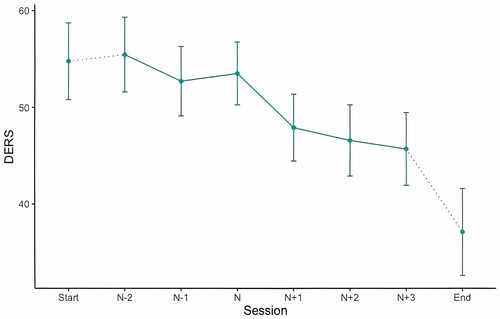
Figure 4. DERS-16 for patients experiencing LIIs with 95% confidence intervals for all time points.