Figures & data
Figure 1. Map of study area, Indonesia, and Yogyakarta Province highlighted.
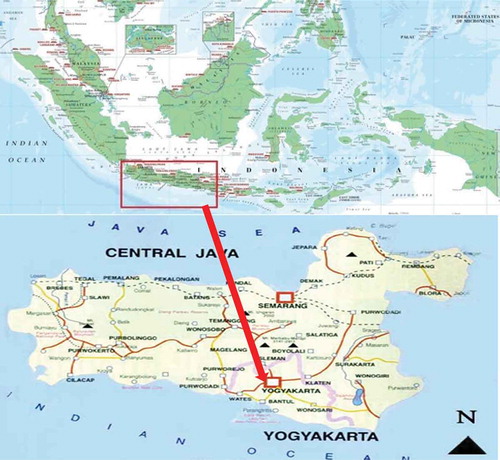
Table 1. The number of species in the different stands, status (native or exotic) and life cycle (annual and perennial), depending on whether they were defined as rare (occur only once) versus restricted (R – occur in only one stand type), intermediate (I – occur in two stand types) or widespread (W – occur in all three stand types) (R + I + W) in the upper rows of the table, and according to use in the lower rows of the table. Note that some species exist in different stand types and have multiple uses.
Table 2. The number (percentage) of species in different distribution categories.
Table 3. The number (percentage) of species in different use categories, depending on whether they were defined as rare (occur only once) versus restricted (R – occur in only one stand type), intermediate (I – occur in two stand types) or widespread (W – occur in all three stand types) (R + I + W). Note that some species have multiple uses and are therefore counted in several of the use categories.
Table 4. The number of useful plant species grouped by the number of potential uses and stand type. Note that the same plants may be present in different stand types.
Figure 2. The total number of useful herb species per plot (m2) in different stand types.
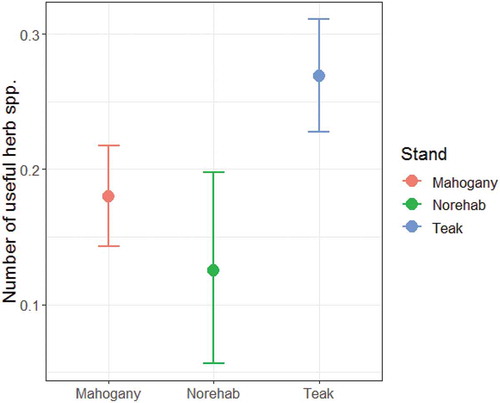
Figure 3. Interaction effects between (a) plant uses and plant status; and (b) plant uses and plant life cycle, on the number of useful herb species per plot (m2).
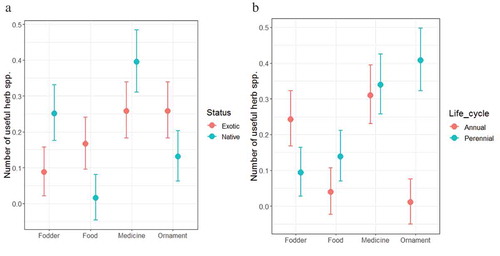
Figure 4. Interaction effects between (a) stand type and plant status; and (b) plant uses and plant status, on the number of woody species per 25 m2.
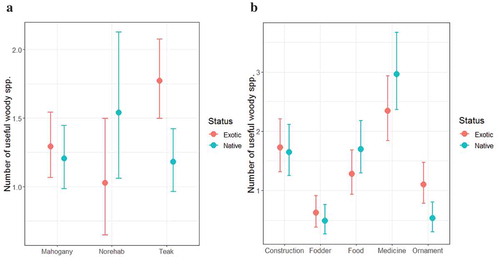
Figure 5. Interaction effects between plant status, plant life cycle and time since rehabilitation (year) on the number of useful herb species per plot (m2).
Figure 6. Interaction effects between plant uses and time since rehabilitation (year) on the number of woody species per plot (25 m2).
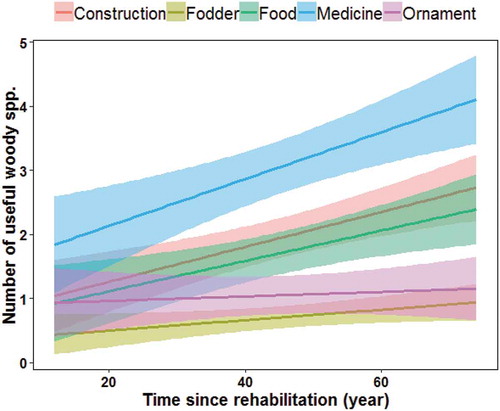
Figure 7. Ordinations with Correspondence Analyses for herb species. Graphs show useful species composition for (a) medicine, (b) food, (c) fodder, and (d) ornament. Significant environmental variables are included with best fit.
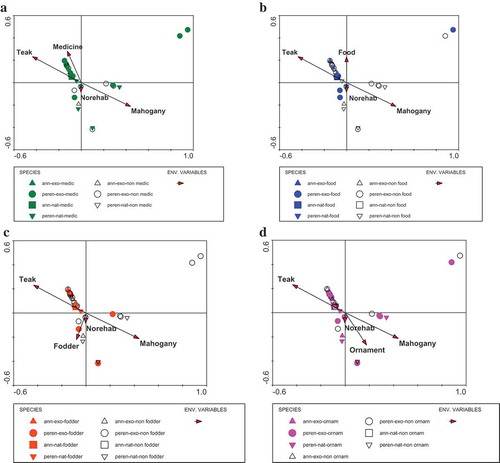
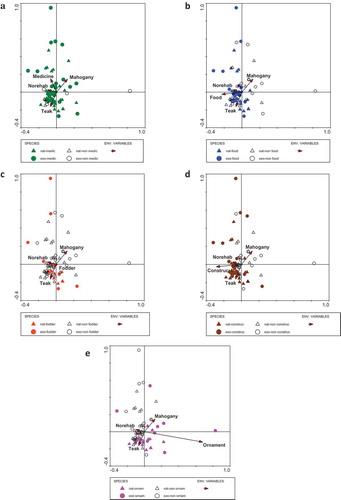
Figure 8. Ordinations with Correspondence Analyses for woody species. Graphs show useful species composition for (a) medicine, (b) food, (c) fodder, (d) construction, and (e) ornament. Significant environmental variables are included with best fit.