
Figures & data
Figure 1. Study area map and plot layout at Kitulangalo Forest Reserve
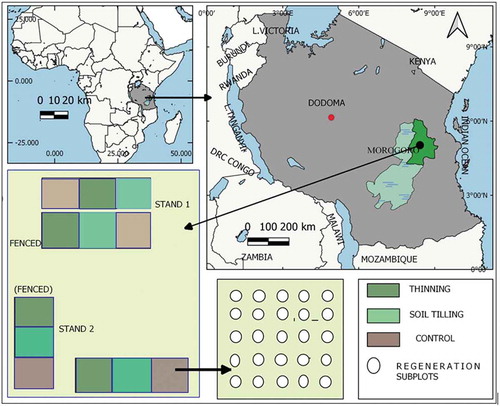
Table 1. Statistical summary for model 1: R2 = 0.70, RMSE = 4.6429
Table 2. Statistical summary for model 2: R2 = 0.11, RMSE = 2.333
Figure 2. Change in the number of stems by the initial number of stems as predicted by (a) model 1 for the total number of stems and (b) model 2 for the number of main stems. Values of other independent variables were set at averages in the data
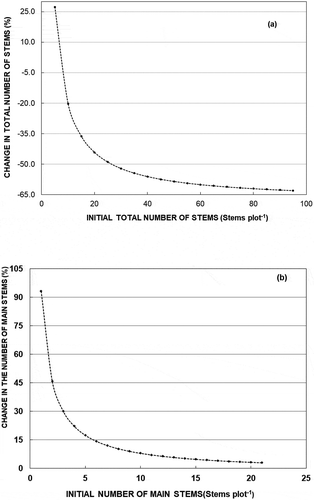
Table 3. Statistical summary for model 3 (Ntot): R2 = 0.14, RMSE = 7.7868
Figure 3. Number of stems on a subplot as predicted by (a) model 3 for the total number of stems and (b) model 4 for the main stems. Values of other independent variables were set at averages in the data
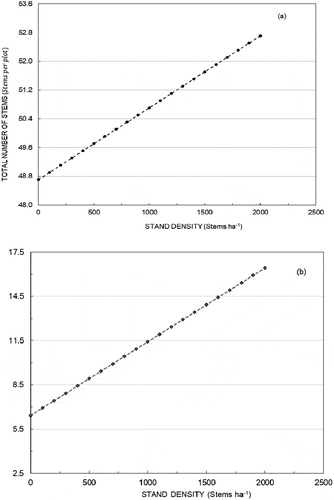
Table 4. Statistical summary for model 4 (Nmain): R2 = 0.24, RMSE = 2.516
Table 5. Statistical summary for silvicultural treatments (model 5) with total number of stems () and number of main stems (
)
Regeneration species list enumerated in Kitulangalo Forest Reserve