
Figures & data
Table 1. Comparisons between implementation school and economically matched and economically controlled schools.
Table 2. Instructional routines used in project ready.
Table 3. Scope and sequence of key skills.
Figure 1. Mean pretest and post-test PELI composite scores across the three groups.
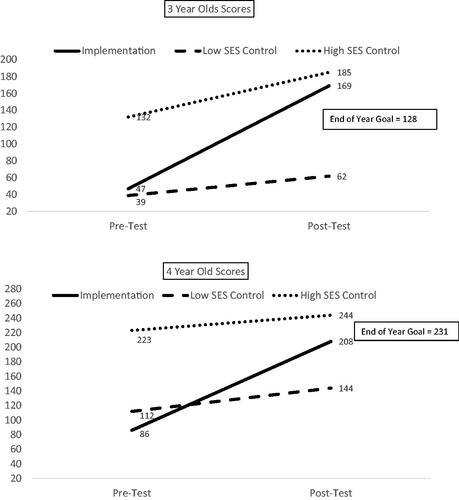
Table 4. Percentage of children at-risk for reading concerns across the three schools.