


Figures & data
Figure 1. Overview project flow.
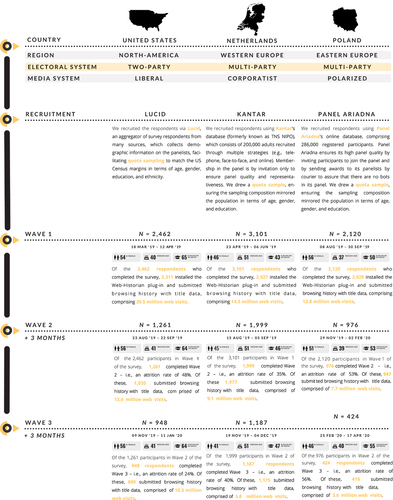
Figure 2. Relative prevalence of the tested exposures.
Figure 3. Prevalence of exposure to news, political content within news domains, and political content outside news domains.
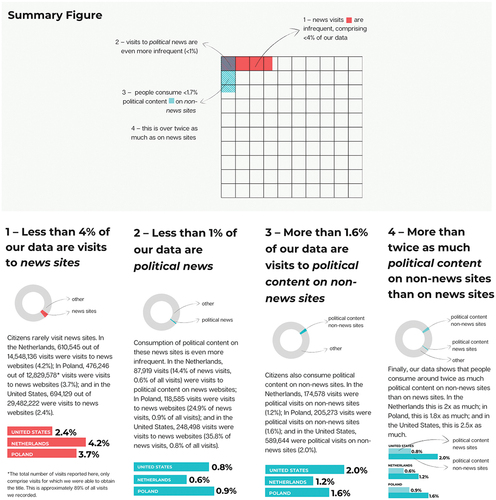
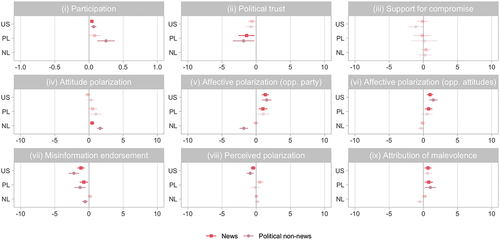
Figure 4. Effects of exposure to news and to political content outside news. Coefficients are from two different random-intercept models, each regressing the outcome on a type of exposure (news or political non-news), as well as a set of controls. These two models correspond to “model 1” and “model 2” in the full regression tables in SM G.1.
Supplemental material
Supplemental Material
Download PDF (5.4 MB)Data availability statement
Data and code to reproduce all results are available at https://osf.io/nd2wj/?view_only=870a157ed80f42aaba08b14b58a1b2da.