Figures & data
Figure 1. Example of CFRP delamination [Citation1].
![Figure 1. Example of CFRP delamination [Citation1].](/cms/asset/24661d3c-964f-4618-83a2-e1c59389e8a1/gnte_a_1590828_f0001_oc.jpg)
Figure 2. Aluminium sheet (3 cm 3 cm) fitted within the carbon fibre layer.
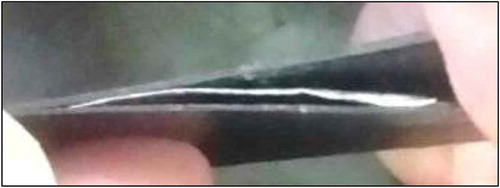
Figure 3. Effect of the sensor’s extra mass on the natural frequency reading.
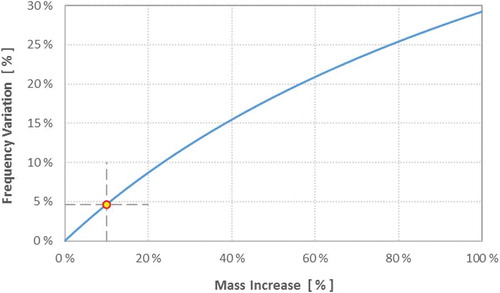
Figure 4. Non-negligible mass installed on top of fixed-fixed bar.
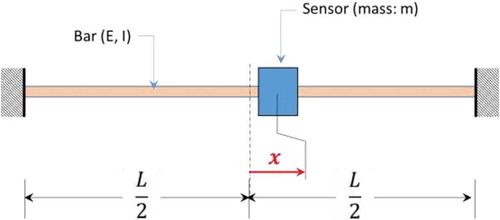
Figure 5. Effect of the added mass on the three modal frequencies of a fixed-fixed bar.
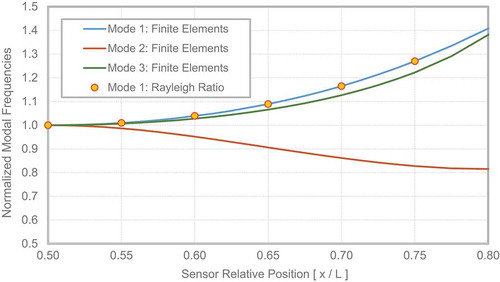
Figure 6. Modal analysis: experimental apparatus.
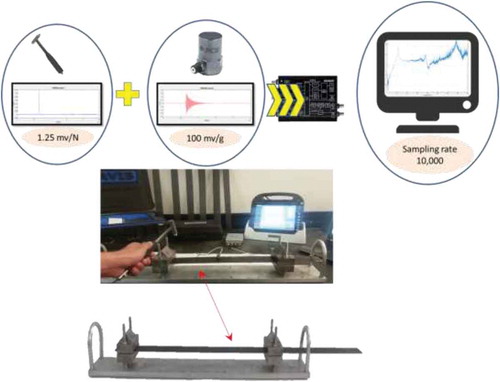
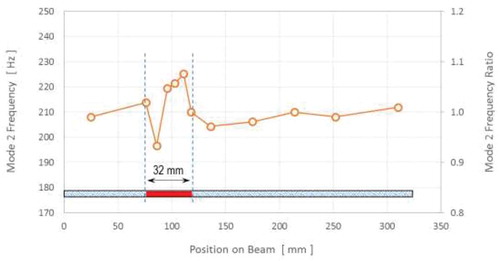
Figure 7. Modal frequencies for delamination located at 50 mm, 71 mm and 105 mm.
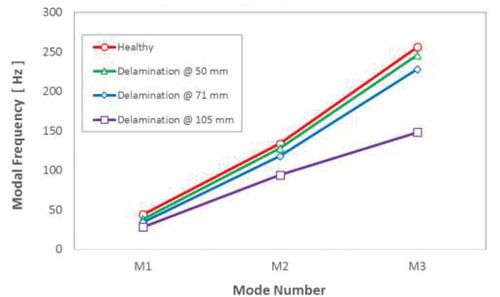
Figure 8. Sensor position versus the three modal frequencies.
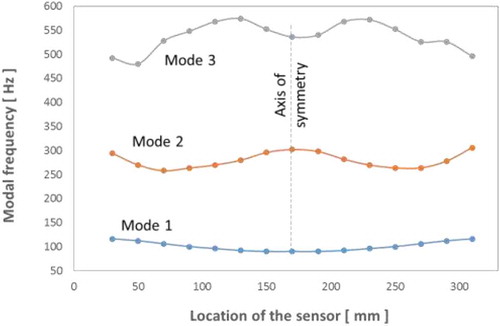
Figure 9. Location of sensors relative to the supports and the axis of symmetry.
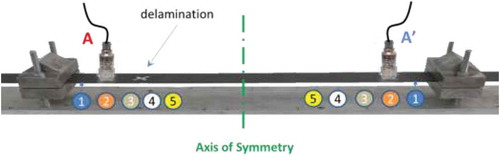
Table 1. Sensor location and frequency shift for the second mode.
Table 2. Sensor location and frequency shift for the third mode.
Figure 10. Frequency shift for the second modal frequency.
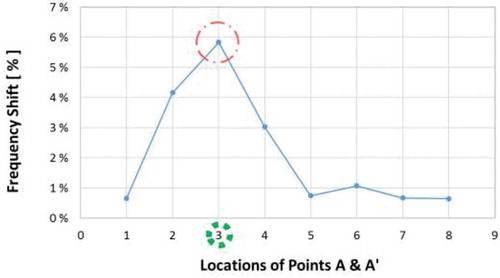
Figure 11. Frequency shift for the third modal frequency.
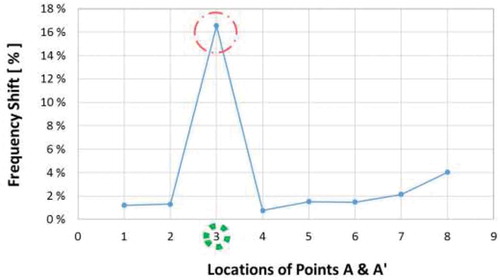
Figure 12. Schematic representation of the restricted motion-based method.
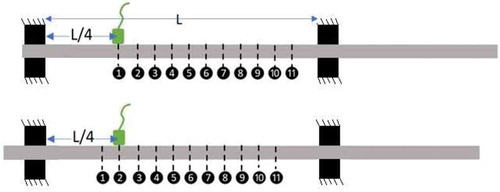
Figure 13. Placement of the accelerometer.
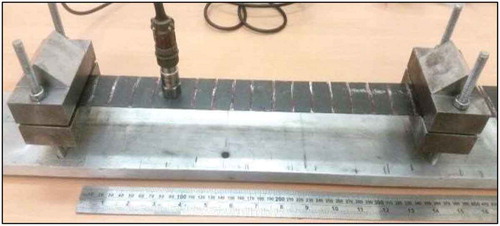
Figure 14. Variation in the first modal frequency according to the restricted motion method.
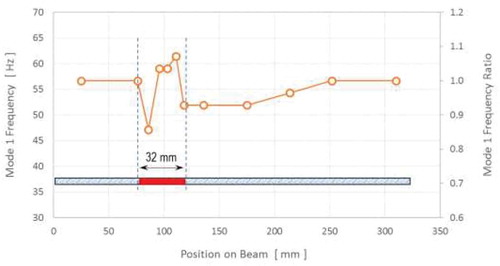
Figure 15. Variation in the second modal frequency according to the restricted motion method.