Figures & data
Table 1. Descriptives, correlations, and reliability estimates of all the variables in the study.
Table 2. Model fit of RSA models and their goodness-of-fit indicators.
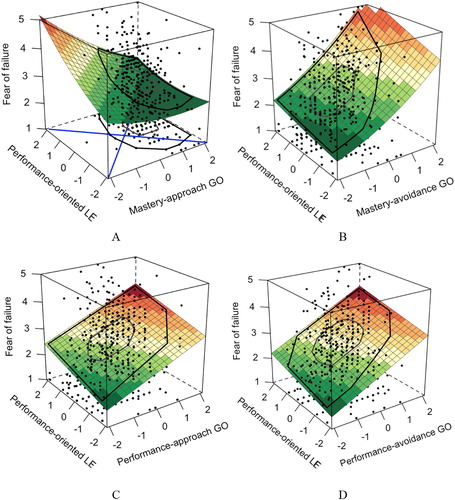
Figure 1. Response surface plots portraying the joint effects on Fear of Failure of (A) personal mastery-approach goal orientation and the perceived institutional performance-oriented learning environment (Performance-oriented LE), (B) personal mastery-avoidance goal orientation and the perceived institutional performance-oriented learning environment, (C) personal performance-approach goal orientation and the perceived institutional performance-oriented learning environment, and (D) personal performance-avoidance goal orientation and the perceived institutional performance-oriented learning environment.