
Figures & data
Table 1. Baseline characteristics stratified per variable that were present for imputation (11).
Table 2. Summary of predictors per model.
Figure 1. Calibration plots of original prognostic models.
In case of perfect calibration all groups of predicted probabilities fit close to the diagonal line, corresponding with an intercept of 0 and a slope of 1 for the calibration plot. Vertical lines in grouped observed represent 95% confidence intervals.
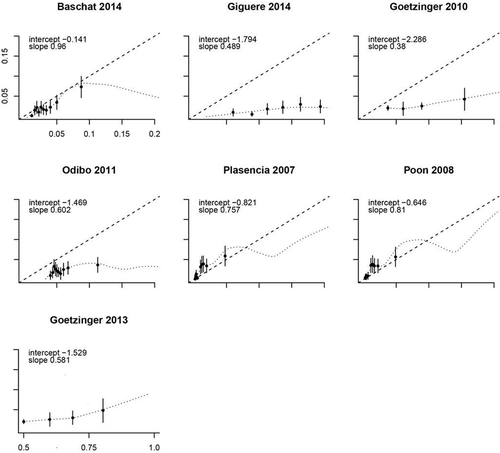
Figure 2. Calibration plots of recalibrated prognostic models.
In case of perfect calibration all groups of predicted probabilities fit close to the diagonal line, corresponding with an intercept of 0 and a slope of 1 for the calibration plot. Vertical lines in grouped observed represent 95% confidence intervals.
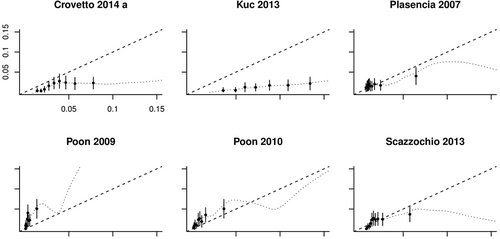
Table 3. Discriminative ability of all prognostic models in the external validation.
Table 4. Pregnancy outcome per predicted risk category.