Figures & data
Figure 1. Preferred reporting items for systematic reviews and meta-analyses flow diagram of study selection.
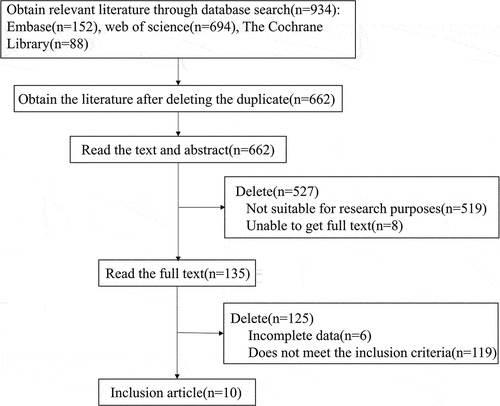
Figure 2. Risk of bias and clinical applicability of the included studies.
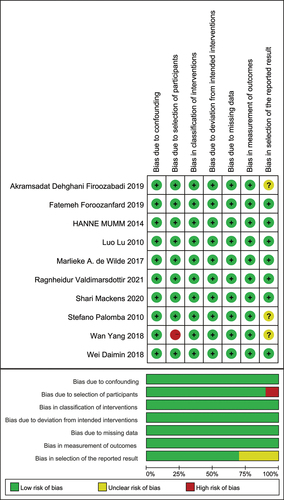
Table 1. Basic characteristics of the included studies.
Figure 3. Pregnancy outcomes comparison: hyperandrogenic PCOS phenotype (polycystic ovary syndrome) versus non-hyperandrogenic PCOS phenotype (A: miscarriage; B: live-birth; C: preterm; D: caesarean section; E: admission to the neonatal intensive care unit).
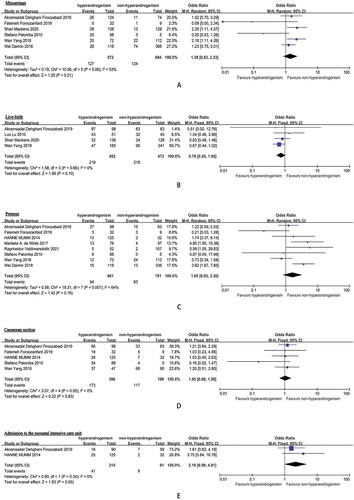
Figure 4. Pregnancy complications comparison: hyperandrogenic PCOS phenotype (polycystic ovary syndrome) versus non-hyperandrogenic PCOS phenotype (A: pregnancy-induced hypertension; B: preeclampsia; C: gestational diabetes mellitus; D: small-for-gestational age; E: large-for-gestational age).
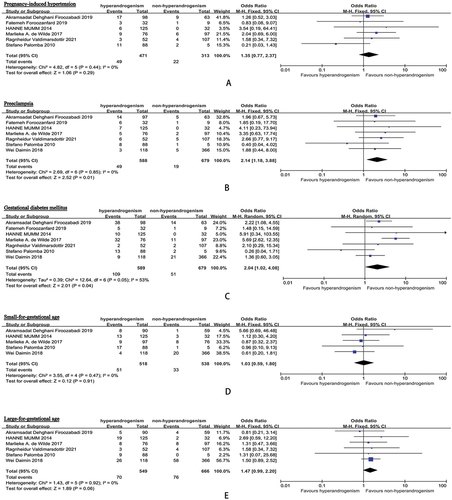
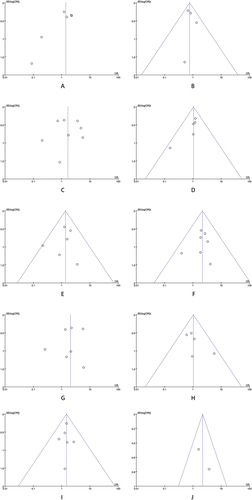
Figure 5. Funnel plot of comparison: hyperandrogenic PCOS phenotype (polycystic ovary syndrome) versus non-hyperandrogenic PCOS phenotype (A: miscarriage; B: live-birth; C: preterm; D: caesarean section; E: pregnancy-induced hypertension; F: preeclampsia; G: gestational diabetes mellitus; H: small-for-gestational age; I: large-for-gestational age; J: admission to the neonatal intensive care unit).