Figures & data
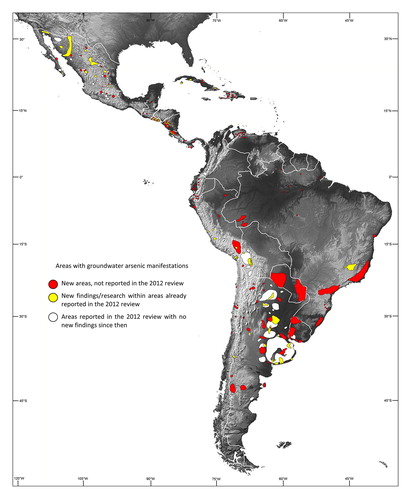
Figure 1. Areas in Latin America’s 20 states affected by arsenic concentrations in groundwater at concentrations toxic for human consumption without previous treatment. Shown are areas that have already have been reported in Bundschuh et al. (Citation2012) (white) with new research in the same areas since then (yellow) and new groundwater arsenic areas not yet reported in this 2012 review (red). The digital elevation model is courtesy of NASA/JPL-Caltech (http://photojournal.jpl.nasa.gov).
MEXICO (MX): Baja California St.: 1 Cerro Prieto geothermal area, 2 San Ignacio-Mulegé, Sierra Guadalupe, 3 Sierra El Mechudo, communities of San Juan de la Costa and Punta Coyote, 4 San Antonio-El Triunfo, 5 Bahía Concepción; Sonora St.: 6 Caborca, Magdalena, 7 Hermosillo, 8 Yaqui River watershed, 9 Etchojoa, 10 Colorado River delta, 11 Guadalupe Victoria, Tobarito; Chihuahua St.: 12 Santa Barbara mining area, 13 Meoqui, Delicias, Julimes, Camargo, Jimenes, 14 Tabaloapa, Aldama, Dolores, 15 Hidalgo del Parral; Nuevo León St.: 16 Monterrey; Zacatecas St.: 17 Zacatecas, 18 Concepción del Oro; Durango and Coahuila St.: 19 Comarca Lagunera; Durango St.: 20 Valle del Guadiana (Durango City and vicinity); Col. 5 de febrero, 21 Cerro de Mercado; San Luis Potosí St.: 22 Santa Ma. de la Paz, 23 Morales in San Luis Potosí city, 24 Río Verde, 25 Soledad de Graciano., 26 Matehuala; Hidalgo St.: 27 Zimapán; Aguascalientes St.: 28 Aguascalientes; Puebla St.: 29 Acoculco geothermal area, 30 Los Humeros geothermal area; Michoacán St.: 31 Los Azufres geothermal area, 32 Cuitzeo Lake; Jalisco St.: 33 Altos de Jalisco; Guanajuato St.: 34 Salamanca, 35 Acámbaro, 36 Independencia, 37 Juventino Rosas Municipality, 38 Aurora Mine Guanajuato; Morelos St.: 39 Huautla; Guerrero St.: 40 Taxco, 41 Tlamacazapa; Oaxaca St.: 42 Oaxaca; Tabasco St.: 43 Cactus-Sitio Grande, 44 Luna-Sen, 45 Jujo-Tecominoacán, 46 Pol-Chuc-Abkatún; Sinaloa St.: 47 Upper San Lorenzo River; Estado de México St.: 48 Ixtapan de la Sal and Tonatico.
GUATEMALA (GU): 1 Marlin mine, 2 Petén Itzá Lake, 3 Joaquina geothermal field, 4 Chinautla and Mixco.
EL SALVADOR (ES): 1 Coatepeque Lake, 2 Ilopango Lake, 3 Olomega Lake. For details and other areas affected see Figures 2 and 3.
HONDURAS (HN): 1 Valle de Siria.
NICARAGUA (NI): 1 Cerro Mina de Agua, 2 El Charco, Santa Rosa del Peñón, 3 Santa Cruz de la India, 4 Kinuma, 5 Zapote,
6 Llano La Tejera, 7 Tipitapa geothermal area. For a detailed As distribution map in water sources see Figure 4.
COSTA RICA (CR): 1 Rincón de la Vieja, 2 Miravalles, 3 Chocosuela-Platanar area, 4 NE Guanacaste, and Caño Negro, Gloria de Aguas Zarcas, Concepción in San Carlos in Alajuela Prov., 5 Cartago City, El Guarco, Turrialba volcano (Cartago Prov.).
PANAMA (PA): 1 Petaquilla, Colón, 2 Azuero Peninsula, 3 Damas Bay, Coiba Island, 4 Bocas de Toro Archipelago.
VENEZUELA (VE) : Lara St.: 1 Las Cuibas, Montañita and Cabudare, Palavecino Municipality, 2 Barquisimeto and Río Turbio, Iribarren Municipality, 3 Tunal Quíbor, rural zone and Caujaral, Jiménez Municipality, 4 Guarico, Río Tocuyo and Tocuyo, Moran Municipality, 6 Torres Municipality, 9 Sarare, Simón Planas Municipality, 11 Sanare, Andrés Eloy Blanco Municipality; Yaracuy St.: 7 Las Velas Yaritagua. Peña Municipality, 8 Aroa, Bolívar Municipality; Portuguesa St: 5 Guanare, Guanare Municipality, 10 Papelón, Papelón Municipality.
Colombia (CO): 1 Córdoba Dep., 2 Sucre Dep., 3 Bolivar Dep., 4 Santander Dep., 5 Antioquia Dep., 6 Cundinamarca Dep., 7 Caldas Dep., 8 Marmato mining district (Caldas Dep.), 9 Valle de Cauca Dep., 10 El Diamante gold mine (Nariño Dep.).
Ecuador (EQ): 1 Tambo River and Papallacta Lake area (Quijos County, Napo Prov.), 2 Guayllabamba, 3 Tumbaco, 4 Geothermal waters from El Carchi, Imbabura, Pichincha, Cotopaxi, and Tungurahua Prov., 5 Yacuambi River, 6 The gold artisanal mining areas of Nambija, Portovelo-Zaruma, and Ponce Enriquez, 7 Calera and Q. Calixto, 8 Intag forest region, 9 Puyango River (Calera and Amarillo rivers which are two of the tributaries of the Puyango River), 10 Portovelo (87 gold processing centers located along the Puyango-Tumbes River), 11 Provinces of Guayas and Los Ríos, and from national supermarkets in the cities of Quito, Daule, Milagros, and Babahoyo.
PERU (PE): 1 Morococha mining region/La Oroya smelting complex (Yauli Prov, Junin Dep.), 2 Rímac River basin, 3 Huaytará prov. (Huancavélica Dep.), 4 Puno (Puno Dep.), 5 Locumba valley (Tacna Dep.; Ilo City water supply), 6 Tacna area (Sama Quebrada de la Yarada, localities: Amopaya, Sama, Inclán; Tacna Dep.), 7 Mórrope Municipality (Lambayeque Dep.), 8 Pucallpa (Ucayali Dep.), 9 Altiplano-Puna, 10 Iquitos (Loreto Dep.).
BOLIVIA (BO): 1 Lower Katari basin, Cohana Bay, Titicaca Lake (T), 2 El Alto (La Paz), 3 Titicaca-Desaguadero-Poopó-Salt pans (TDPS) basin: T: Titicaca, U: Uru and Poopó lakes, 4 Poopó basin, 5 Upper Pilcomayo River basin, 6 North of Potosí Dep., 7 Lipéz and south of Potosí Dep.
CHILE (CL): 1 Chinchorro, Arica and Parinacota region, 2 Esquiña, Illpata, Camarones, Arica y Parinacota Region, 3 Puchuldiza geothermal field, Tarapacá Region, 4 Loa River basin, Chiu Chiu, Holjar and Toconce rivers, 5 El Tatio Geysers, 6 Antofagasta port, 7 Portreillo smelters, 8 Copiapó River valley, Atacama Region, 9 Valle del Elqui, El Indio, 10 El Indio, Coquimbo Region, 11 Ventanas industrial complex, 12 Maipo River basin.
ARGENTINA (AR): Principal regions: 1 Pampean plain, 2 Chaco plain, 3 Cuyo, 4 NW region and Puna, 5 Patagonian Andes, 6 Patagonia. Subregions: The subregions of 1-6 are listed in Table SM 4).
URUGUAY (UR): 1 Raigon aquifer, 2 Mercedes aquifer, 3 Chuy aquifer, 4 Guarani aquifer
PARAGUAY (PA): 1 Yenda-Toba-Tarijeño, 2 Guarani aquifer
BRAZIL (BR): Minas Gerais St.: 1 Iron Quadrangle” region (Nova Lima Dist., Santa Bárbara Dist., Ouro Preto/Mariana Dist., 2 Paracatu; São Paulo and Paraná St.: 3 Ribeira Valley region (Adrianópolis, Apiaí, Eldorado); Amapá St.: 4 Santana Dist., 5 Laranjal do Jari; Amazonas St.: 6 Anori, 7 Aruanã farm, Itacoatiara; Roraima St.: 8 Caracaraí; Acre St.: 9 Sena Madureira, 10 Rio Branco, 11 Xapuri; Mato Grosso St.: 12 Itaúba; Pará St.: 13 Santarem; Bahia St.: 14 Baía de Todos os Santos; Espirito Santo and Rio de Jaineiro St.: 15 Brazilian coast; Santa Catarina St.: 16 Coal mining areas (Lauro Müller, Treviso, Sideropólis, Criciúma); Rio Grande do Sul St.: 17 Patos Lagoon estuary.
DOMIMICAN REPUBLIC (DR): 1 Pueblo Viejo mining area, 2 Falcondo mining area, 3 Cerro de Maimón deposits, 4 La Duquesa landfill.
HAITI (HA): The Plaine du Cul-de-Zac aquifer, 2 The Etang Saumâtre Lake, 3 Trou du Nord River and Village of Fleury, Caracol Commune.
CUBA (CU): 1 Cienfuegos Bay, 2 Sagua la Grande River, northern Villa Clara Province, 3 Moa Bay, 4 Delita gold deposits, Juventud Island, 5 San Fernando mine.
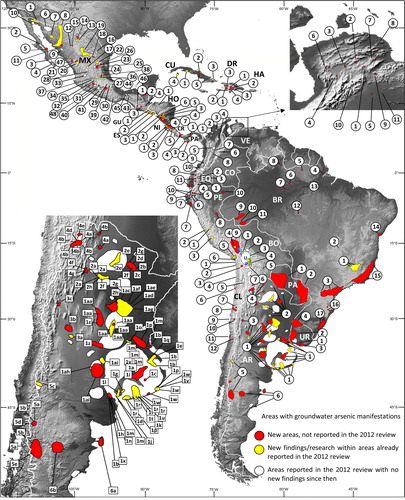
Figure 2. Arsenic in potable water of El Salvador.
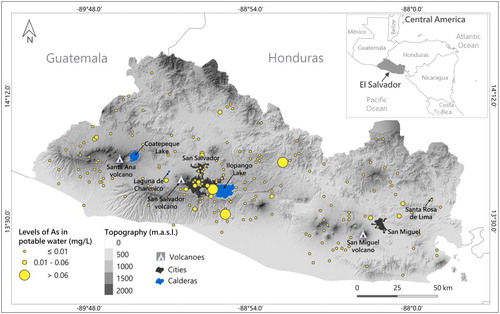
Figure 3. Arsenic in rivers of El Salvador (after Mejía López, Citation2019). Data from MARN (Citation2017). Insert represents the mined region of El Salvador and the rivers affected by mine contamination.
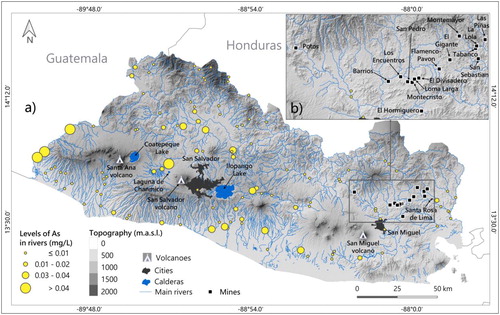
Figure 4. Left: Arsenic concentrations (in μg L−1) in water samples from Nicaragua (2010-2019). Right: Water units, 42 according to Pfafstetter Methodology.
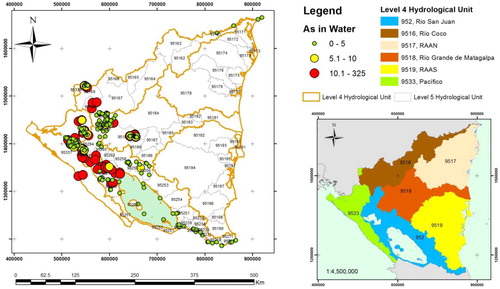
Table 1. Arsenic levels in water for animal, agricultural touristic and industrial production at the West Center region of Venezuela in the states of Lara, Portuguesa and Yaracuy. Source: Own unpublished data.
Table 2. Levels of Arsenic in human consumption water in municipalities of Lara, Yaracuy and Portuguesa states, Venezuela.
Table 3. Arsenic concentration ranges in soils of Terepaima National Park, Campus and University Park (Palavecino Municipality, Lara State). Source: Own unpublished data.
Table 4. Concentration of arsenic in soil and vegetation at a main avenue, (Lara Avenue) Barquisimeto City, Iribarren Municipality, Lara State. Source: own unpublished data.
Table 5. Arsenic concentration in animal food at the westcentral region of Venezuela. Source: own unpublished data.
Table 6. Arsenic concentrations in organic fertilizers, agrochemicals and raw materials. Source: own unpublished data.
Figure 5. Arsenic distribution and concentration box plots of distinct water types (brines: Risacher et al., Citation1999; Tapia, Davenport, et al., Citation2018; saline water: Risacher et al., Citation1999; Tapia, Davenport, et al., Citation2018; hot springs: Aguilera et al., Citation2014; Chong et al., Citation2010; Hauser, Citation1997; Lemus et al., Citation2015; Pérez, Citation1999; Risacher & Hauser, Citation2008; Sánchez-Yañez et al., Citation2017; Wrage et al., Citation2017; surface water: DGA, Citation2017; Lagomarsino et al., Citation2018; Risacher et al., Citation1999; Romero et al., Citation2003; Tapia, Davenport, et al., Citation2018; groundwater: DGA, Citation2017; Leybourne & Cameron, Citation2008; Soto, Citation2010) and solid materials (tailing impoundments: SERNAGEOMIN, Citation2017; continental sediment: Astudillo et al., Citation2015; Baeza et al., Citation2014; Barrera et al., Citation2017; Espinoza et al., Citation2016; Lacassie et al., Citation2014; Lagomarsino et al., Citation2018; Narváez et al., Citation2007; Oyarzún et al., Citation2004; Palma-Fleming et al., Citation2012; Romero et al., Citation2003; marine sediment: Valdés & Tapia, Citation2019; soil: Agriquem, Citation2009; Alfaro et al., 2017; CENMA, Citation2014; De Gregori et al., Citation2003; López, Citation2014; Parra et al., Citation2014; PSG, Citation2015; PSG, Citation2016; volcanic and intrusive rocks: Benavides, Citation2006; Mamani et al., Citation2010; Marschik et al., Citation2003) found in the Central Volcanic Zone, Pampean Flat Slab, and Southern Volcanic Zone of Chile. The dashed horizontal lines in the box plots correspond to reference concentrations for comparison; for water (left-hand box plots), a reference concentration of 10 µg L−1 is shown (NCH Citation409, Citation409, Citation2006; WHO, Citation2011), and for solid materials (right-hand box plots), the mean As value found in the continental crust is shown (Hu & Gao, Citation2008). The distinct administrative regions of Chile are also numbered and shown in plan view from north to south: (XV) Arica and Parinacota, (I) Tarapacá, (II) Antofagasta, (III) Atacama, (IV) Coquimbo, (V) Valparaíso, (XIII) Metropolitan Region (where Santiago is the capital), (VI) Libertador Bernardo O'Higgins, (VII) Maule, (XVI) Ñuble, (VIII) Bio Bio, (IX) Araucanía, (XIV) Los Ríos, (X) Los Lagos, (XI) Aysén, (XII) Magallanes.
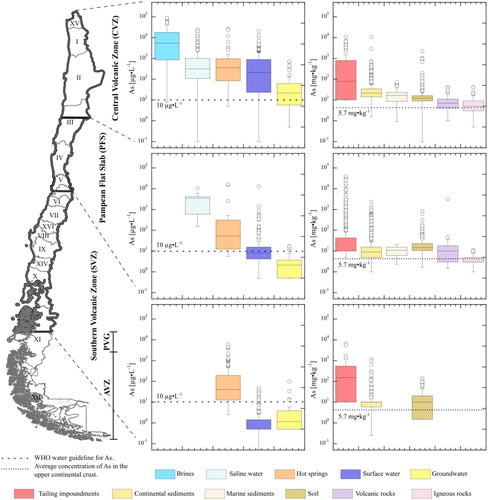
Table 7. Variation of Arsenic concentration along the course of the Copiapó River.
Table 8. As content in soils (mg kg−1) and in water bodies (µg/L−1) according to Brazilian legislation.
Table 9. Arsenic content in hair, urine and blood, meat and liver of cattle and chicken (μg g−1) obtained in different studies in Brazil regions, states or cities.