Figures & data
Table 1. Intra-class Correlation Coefficients (ICC) accounting for site and exhibit level variance in key dependent variables.
Table 2. Bivariate correlations between key variables.
Table 3. Independent sample t-tests based on educator age for the three composite questions underlying the educator engagement score.
Figure 1. Educator engagement as a function of participant age and educator age (w. standard error bars, * indicates p <.05, N.S. = nonsignificant).
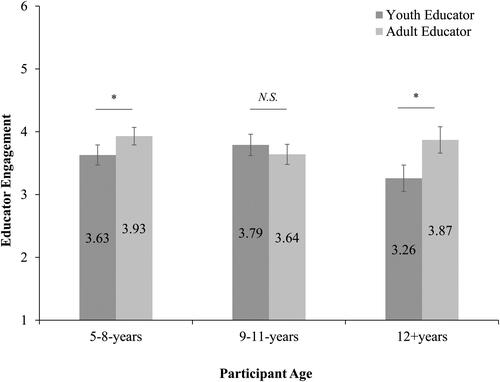
Figure 2. Educator engagement as a function of participant gender and educator age (w. standard error bars, ** indicates p <.005, N.S. = nonsignificant).
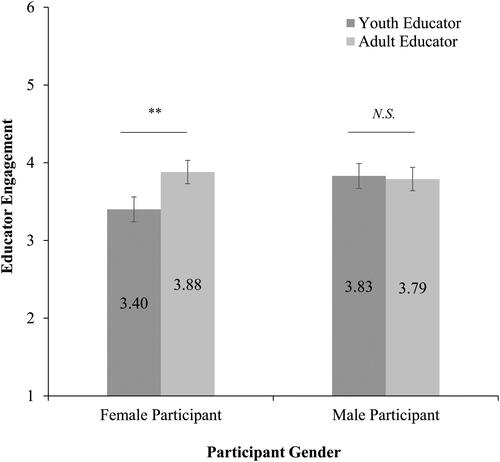
Figure 3. Moderation of self-reported exhibit learning by educator engagement and topic interest.
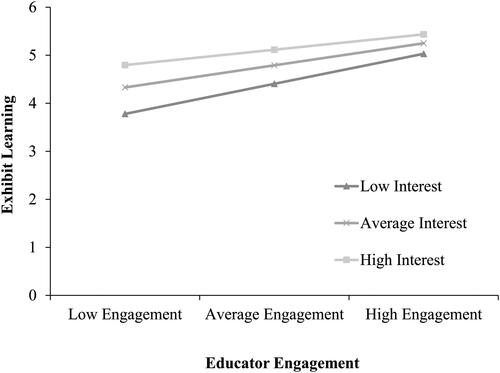
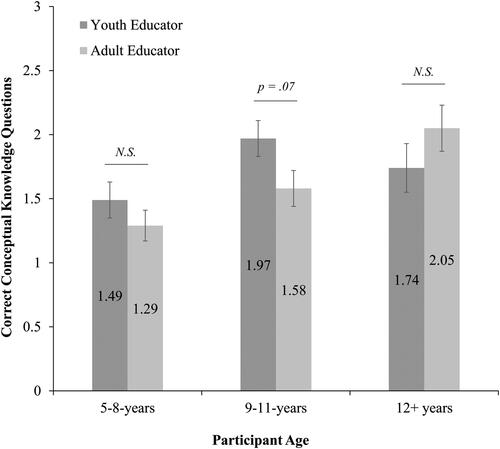
Figure 4. Correct conceptual knowledge questions as a function of participant age and educator age (w. standard error bars, N.S. = nonsignificant).