Figures & data
Figure 1. (a) SEM image of as-received Ti3C2Tx MXene flakes, (b) high-magnification SEM image of a typical MXene flake and its preparation mechanism, (c) a bright-field (BF) TEM image showing the surface morphology of as-treated MXene, (d) and (e) BF TEM images showing the cross-sectional morphologies of few-layered and monolayered MXene nanosheets, respectively.
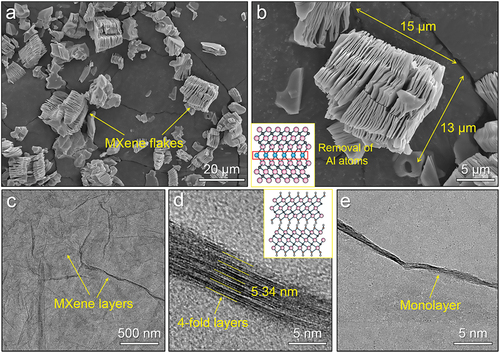
Figure 2. (a) and (b) SEM images of powder mixture prepared from pristine Ti powder and the CTAB-modified MXene nanosheets by ball-milling, (c) and (d) SEM images of CTAB-modified MXene-coated Ti powder prepared by solid-liquid fluidised bed.
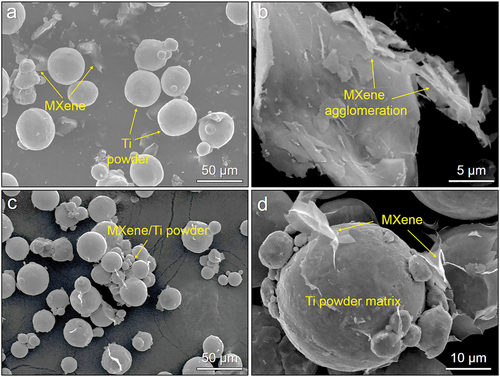
Figure 3. SEM images of MXene/Ti composite powder fabricated by fluidised bed at different MXene concentrations: (a) 0.1 wt.%, (b) 0.3 wt.%, (c) 0.5 wt.% and (d) 1.0 wt.%.
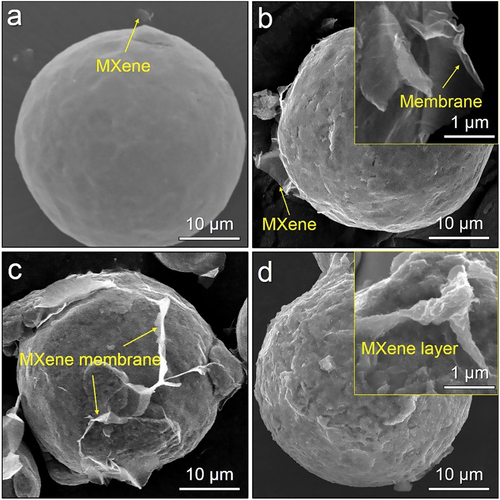
Figure 4. SEM images of MXene/Ti composite powder fabricated by solid-liquid fluidised bed under a fixed MXene concentration of 0.5 wt.% but using different flow velocity: (a) 5sccm, (b) 3 sccm, (c) 1 sccm and (d) 0.5sccm.
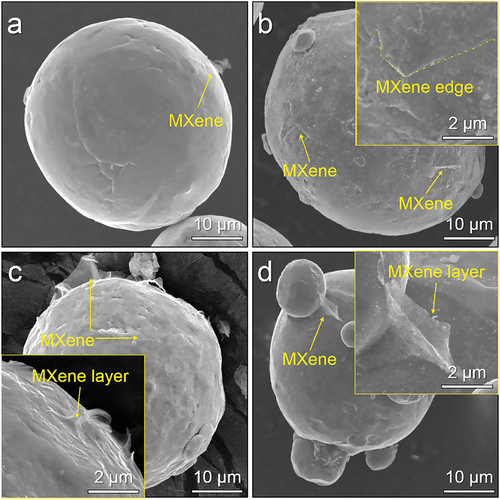
Figure 5. Variation of MXene-content in composite powder as a function of fluidisation time.
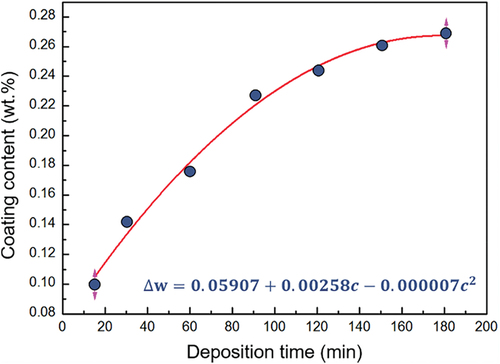
Figure 6. (a) SEM image of the thermal-reduced MXene/Ti composite powder, and (b) laser reflectivity of pristine Ti powder and the MXene/Ti composite powder.
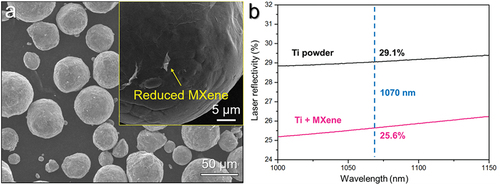
Figure 7. (a) Photographs of as-printed cubes of MXene/Ti composite powder under different parameters, and (b) the relative density of the as-printed cubes.
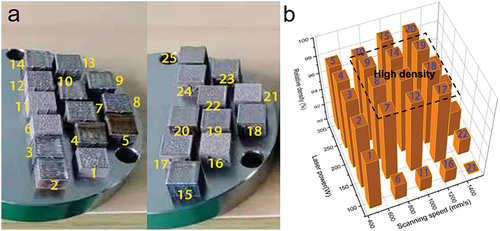
Table 1. Numbering of as-printed samples under different printing parameters.
Figure 8. SEM images of samples printed from MXene/Ti composite powder, showing the as-printed microstructure at different printing conditions.
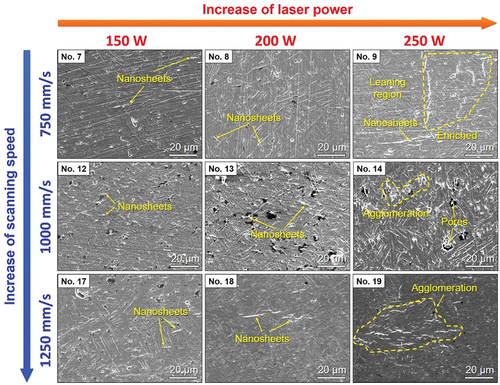
Figure 9. High-magnification SEM images of as-printed samples, showing morphology and distribution of remained MXene nanosheets and their effect on the Ti matrix.
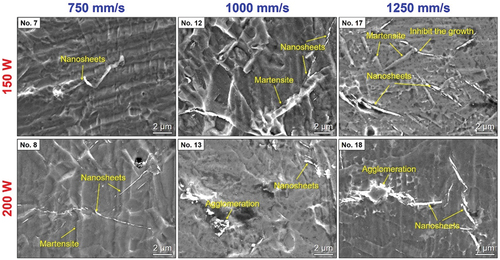
Figure 10. TEM studies of samples (a-c) S8 and (d-f) S17: (a, d, e) BF TEM images showing the morphology and distribution of remained MXene and the as-printed microstructure, (b) the corresponding DF TEM image of (a), (c) and (f) the morphology of extracted secondary phase from as-printed samples, and the insets in (c) and (f) are corresponding diffraction patterns and the composition of extracted phase, respectively.
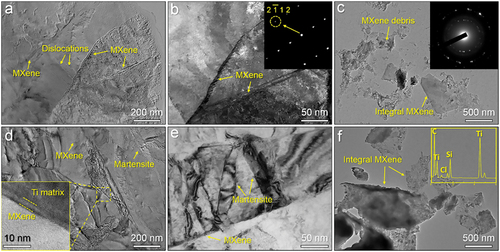
Figure 11. (a) Tensile stress‒strain curves of as-printed MXene/Ti composites under different parameters, and (b) comparison of tensile properties among our printed composites with as-printed pure Ti sample and the ASTM standard cast Ti64 alloy.
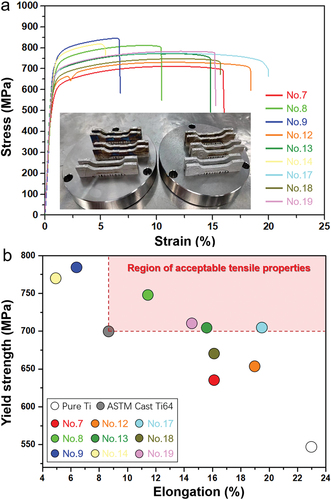
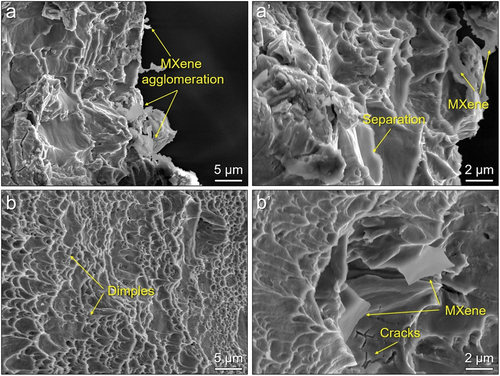
Figure 12. SEM images of fracture surface of as-printed samples: (a) S8, (b) S13, (c) S17 and (d) S19.
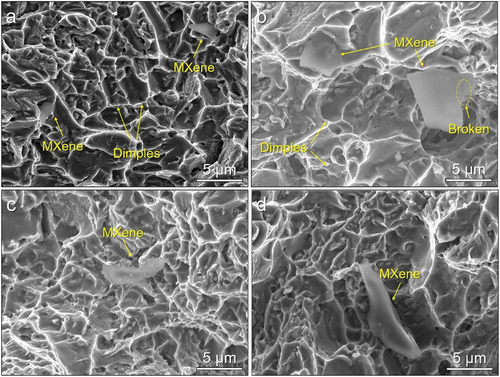
Figure 13. Cross-sectional SEM fractograph of samples: (a and a’) S8 and (b and b’) S17.