
Figures & data
Scheme 1. Schematics of the fabrication process of the PdNPs-5-PADAT/GCE.
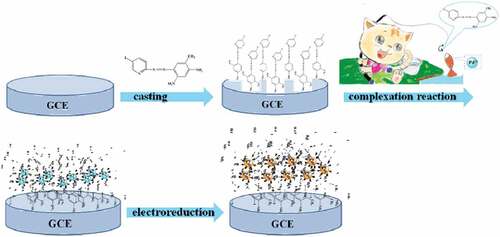
Figure 1. SEM imagines of PdNPs/GCE (a) and PdNPs–5-I-PADAT/gce(b).
Figure 2. Cvs of PdNPs–5-I-PADAT/gce in 0. 1 mol/L, pH 7.0 PBS at scan rates of 0.1 V/s with the adding of different N2H4 concentration (from a to m: 0, 0.0662, 0.130, 0.198, 0.269, 0.349, 0.433, 0.520, 0.615, 0.721, 0.864, 1.02, 1.2 μmol/L).
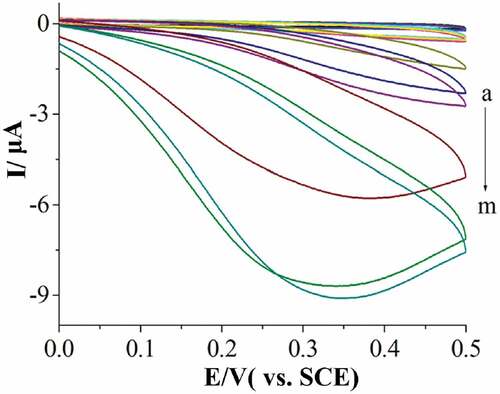
Figure 3. Amperometric curves obtained upon the addition of an aliquot concentration of N2H4 into a continuous stirring of 0.1 M, pH 7.0 PBS under different potentials.
Figure 4. Amperometric curves of PdNPs/GCE and PdNPs–5-I-PADAT/gce obtained upon the addition of an aliquot concentration of N2H4 into a continuous stirring of 0.1 M, pH 7.0 PBS.
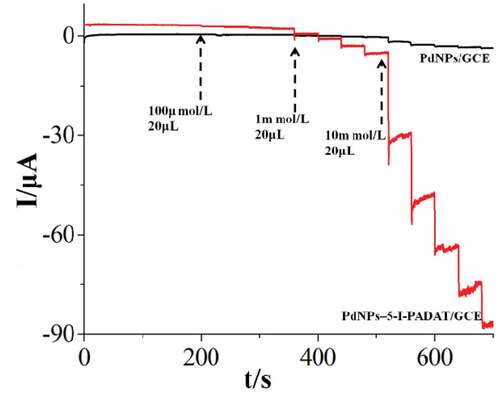
Table 1. Effect of interfering substance on the detecting of 1 μmol/L hydrazine hydrate. Ratio denotes the ratio of the concentration between the interfering substance and hydrazine, i.e. [ion]/[N2H4].