Figures & data
Figure 1. As cast Mg-5Sn-0.2Ca-0.2Mn (a) SEM micrograph, (b) optical micrograph, (c) EDS spectrum and (d) average grain size distribution.
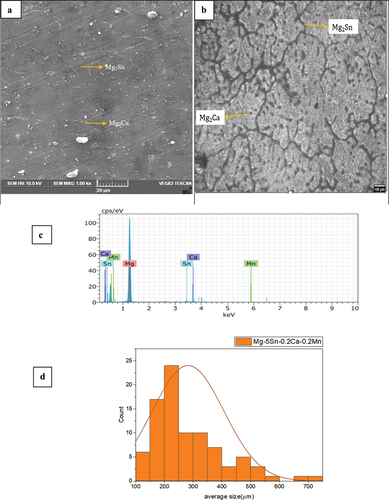
Figure 2. SEM micrographs and EDS spectrum of as cast Mg-5Sn-0.2Ca-0.2Mn immersed in (a) NaCl, (b) NaCl +0.1 wt.% TSP, (c) NaCl +0.2 wt.% TSP, (d) NaCl +0.3 wt.% TSP.
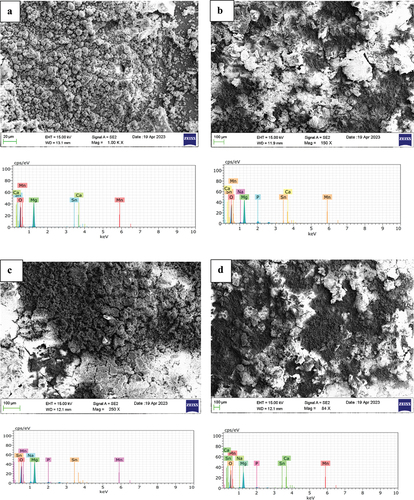
Figure 3. Corrosion inhibition behaviour.
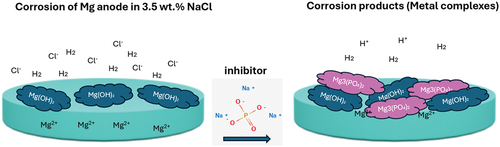
Table 1. Chemical composition of corroded samples.
Figure 4. pH value of Mg alloy immersed in electrolytes for 72 hours.
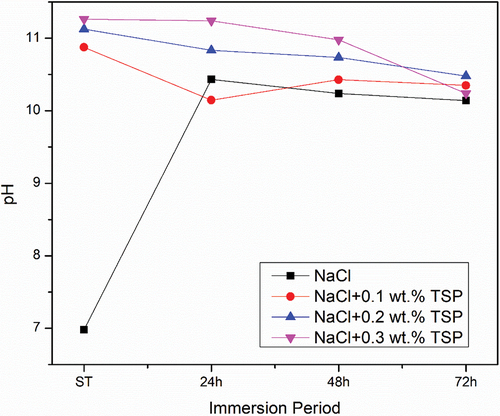
Table 2. Weight gain of Mg alloy during 72 hours of immersion.
Figure 5. Open circuit potential of Mg alloy with different concentration of TSP.
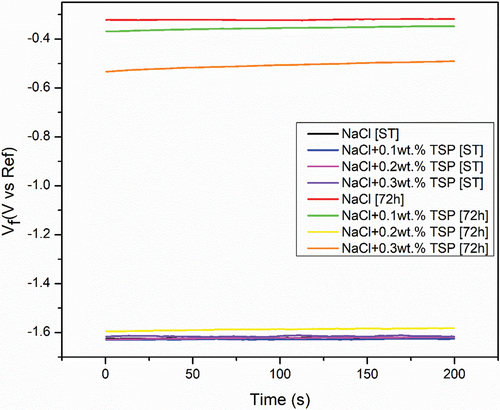
Figure 6. Nyquist plots of Mg-5Sn-0.2Ca-0.2Mn in different concentration of inhibitor.
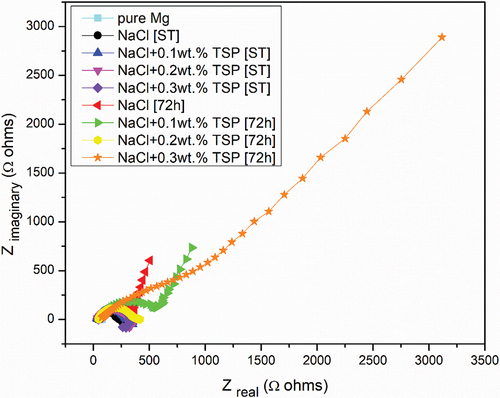
Figure 7. Z curves of bode plot for Mg-5Sn-0.2Ca-0.2Mn alloy.
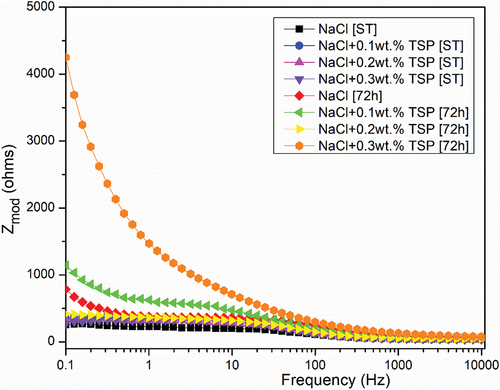
Figure 8. Phase angle of bode plots for Mg-5Sn-0.2Ca-0.2Mn alloy.
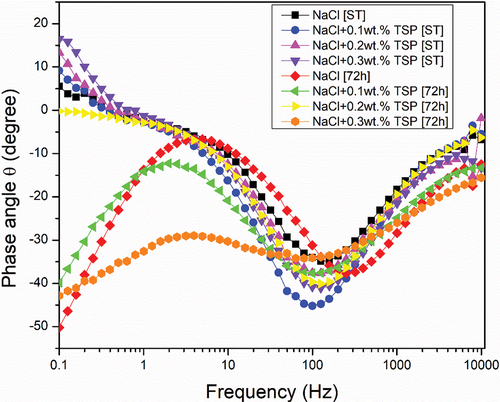
Figure 9. Equivalent circuit for short term immersed samples.
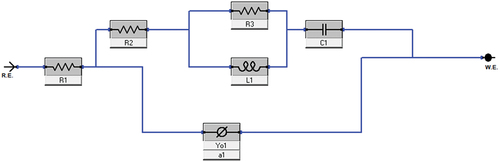
Figure 10. Equivalent circuit for 72 hours immersed samples.
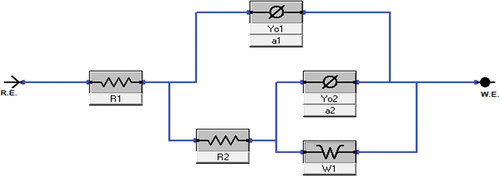
Table 3. Open potential circuit results after 200 seconds.
Table 4. EIS results of Mg-Sn-Ca-Mn alloys.
Figure 11. Tafel curves of Mg-5Sn-0.2Ca-0.2Mn for different immersion period in different electrolyte concentrations
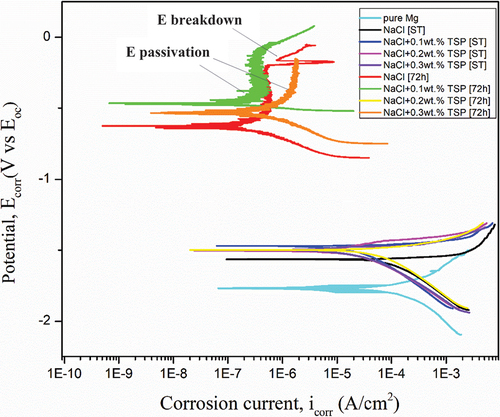
Table 5. Corrosion results of Mg-5Sn-0.2Ca-0.2Mn alloys estimated by the tafel extrapolation method.
Table 6. Inhibitor efficiency of trisodium phosphate.
Figure 12. CV curves of Mg alloy in (a) NaCl (b) 0.1wt. % TSP (c) 0.2wt. % TSP (d) 0.3wt. % TSP for short term of immersion.
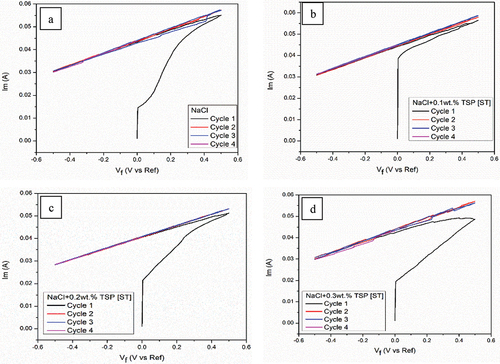
Figure 13. CV curves of Mg alloy in (a) NaCl (b) 0.1wt. % TSP (c) 0.2wt. % TSP (d) 0.3wt. % TSP for 72 hours of immersion.
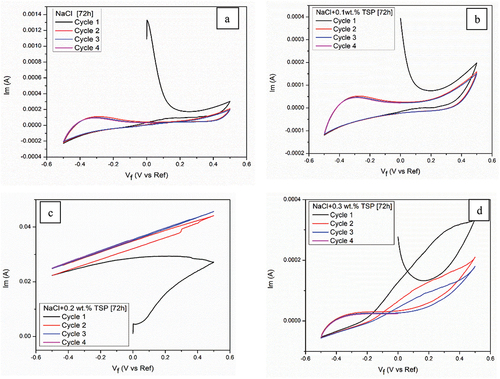
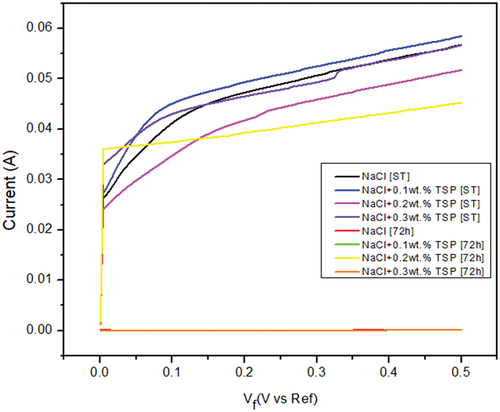
Figure 14. Linear sweep voltammetry curves of Mg alloy in different concentrations for ST and 72h.