
Figures & data
Figure 1. FTIR spectra (a) and XRD patterns (b) of samples. The high-resolution XPS of Nb and O elements in Nb2O5/PVP sample.
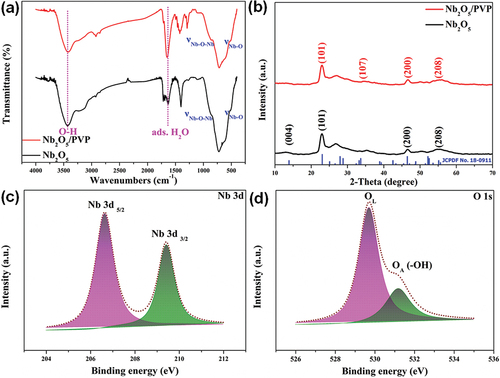
Figure 2. SEM images of Nb2O5 (a) and Nb2O5/PVP (b, c). TEM (d, e) and HRTEM (f) images of Nb2O5/PVP.
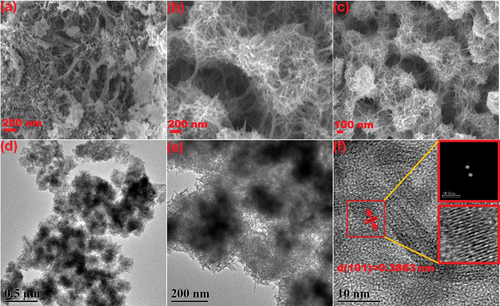
Figure 3. The N2 adsorption-desorption isotherms (a), pore properties (b), variation curve of statistical thickness with p/p0 (c) of pristine Nb2O5 and Nb2O5/PVP.
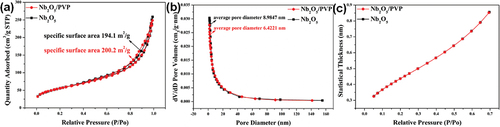
Figure 4. The photodegradation reaction of MO/RhB using Nb2O5 and Nb2O5/PVP and the associated reaction kinetics.
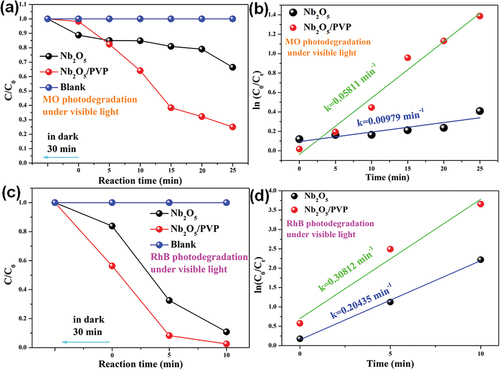
Figure 5. The photodegradation reaction of TC using Nb2O5/PVP and the associated reaction kinetics.
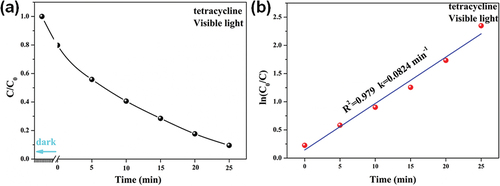
Table 1. Comparison of visible-light-driven photocatalysis for TC degradation.
Figure 6. The reuse performance.
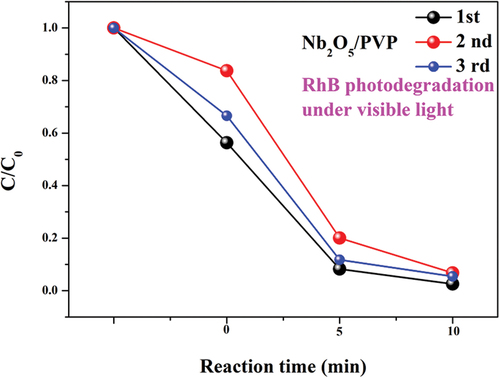
Figure 7. The UV-vis DRS spectra of Nb2O5 (a) and Nb2O5/PVP (b), (Inset: The related band gap energy); PL spectra (c) and EIS spectra (d) of Nb2O5 and Nb2O5/PVP.
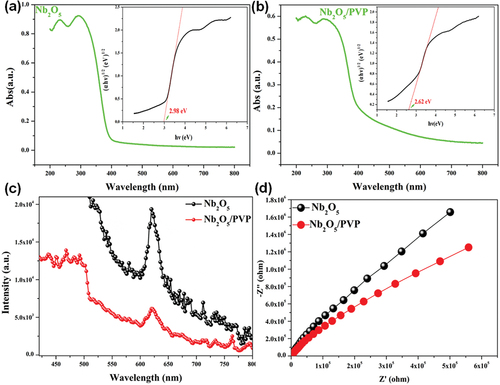
Figure 8. DMPO spin-trapping ESR spectra in Nb2O5 and Nb2O5/PVP in dark or under ultraviolet visible light irradiation: (a) and (b) in aqueous dispersion for DMPO-·OH, (c) and (d) in methanol dispersion for DMPO-·O2−.
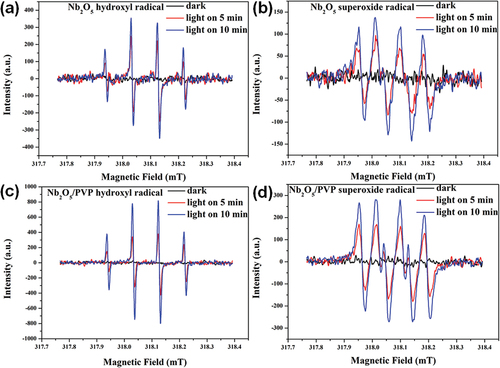
Table 2. The intensity value of free radical signal and the related square value from ESR test.