
Figures & data
Figure 1. Timing of outcome measurement. During each intervention, sCOR concentrations and HRV data were collected in clinic at three timepoints, baseline or five-minutes prior to the intervention (pre-5), then five-minutes (post-5) and thirty-minutes (post-30) following the intervention. Baseline sCOR samples were collected at home on day five and six between the hours of 2200–0000 (baseline-pm). sCOR samples were then collected the night following the intervention between the hours of 2200–0000 (post-pm). HRV data was collected each morning on waking, at home, between the hours of 0600–0800. Day two to seven were baseline HRV data (baseline-am). Day eight was post-intervention HRV data (post-am). RPQ data was filled out at the same time as sCOR samples were collected on day six (baseline-pm) and seven (post-pm), and HRV data on day seven (baseline-am) and eight (post-am).
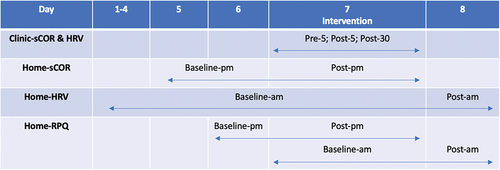
Figure 2. Flow of participants.
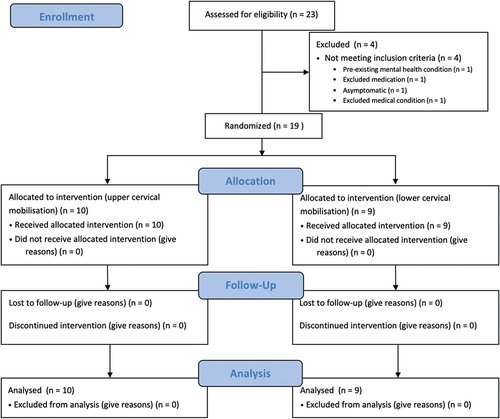
Table 1. Baseline participant characteristics (n = 19).
Table 2. Clinical measurements of salivary cortisol and rMSSD.
Table 3. Home measurements of salivary cortisol and rMSSD.
Table 4. RPQ scores.
Figure 3. Clinic measurement of salivary cortisol (figure includes 95% confidence interval error bars).
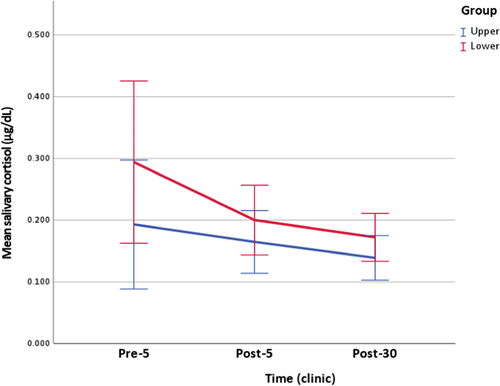
Figure 4. Clinic measurement of rMSSD (figure includes 95% confidence interval error bars).
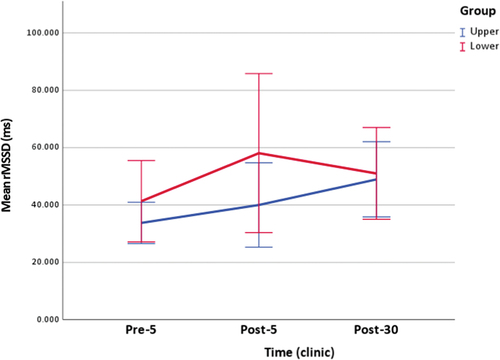
Figure 5. Home measurement of salivary cortisol (figure includes 95% confidence interval error bars).
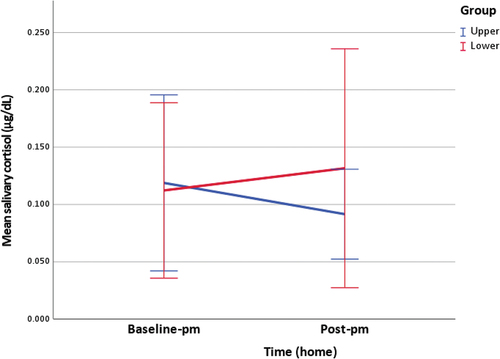
Figure 6. Home measurement of rMSSD (figure includes 95% confidence interval error bars).
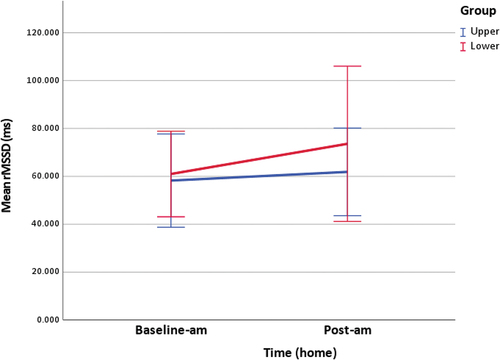
Figure 7. RPQ score filled out at the same time as sCOR.
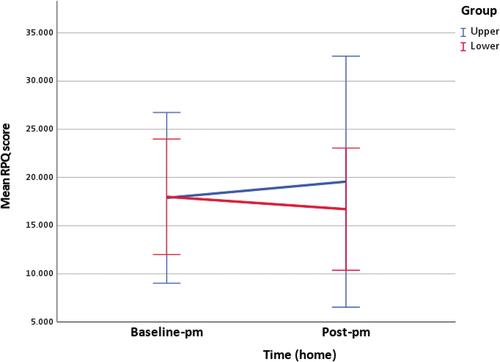
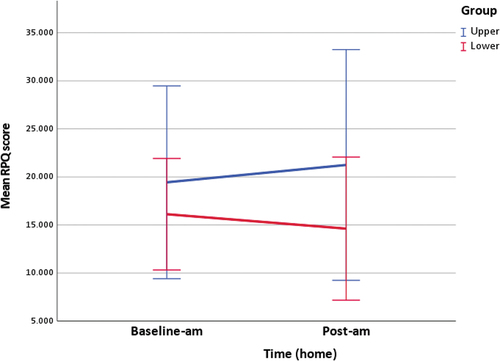
Figure 8. RPQ score filled out at the same time as rMSSD.
Supplemental Material
Download MS Word (823.3 KB)Data availability statement
The data that support the findings of this study are available from the corresponding author upon reasonable request.