2,769
Views
2
CrossRef citations to date
0
Altmetric
Articles

‘He seems odd’: the effects of risk-irrelevant information and actuarial risk estimates on mock jurors’ perceptions of sexual recidivism risk

ORCID Icon, ORCID Icon, ORCID Icon, ORCID Icon & ORCID Icon
Pages 342-371 | Received 14 Apr 2020, Accepted 02 Mar 2021, Published online: 02 Apr 2021

Figures & data

Table 1. Risk factors of the static-99R.

Figure 1. Raincloud Plot and Boxplot of T2 Risk Estimate Distribution. Note. N = 427. Raincloud plot and boxplot showing the positively skewed distribution of participants’ risk estimates at T2. The horizontal shaded band represents the 5-year sexual reoffending rate indicated by the Static-99R information (7.0%–8.8%). The black dots with error bars represent group means and 95% confidence intervals. The boxplot whiskers span 1.5 times the interquartile range (trimmed at 0% and 100%).

Figure 1. Raincloud Plot and Boxplot of T2 Risk Estimate Distribution. Note. N = 427. Raincloud plot and boxplot showing the positively skewed distribution of participants’ risk estimates at T2. The horizontal shaded band represents the 5-year sexual reoffending rate indicated by the Static-99R information (7.0%–8.8%). The black dots with error bars represent group means and 95% confidence intervals. The boxplot whiskers span 1.5 times the interquartile range (trimmed at 0% and 100%).

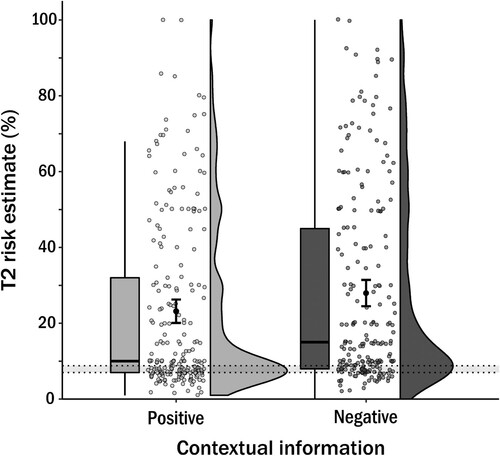
Table 2. Results of hierarchical multiple linear regression analysis predicting participants’ T2 risk estimates.

Table 3. Results of hierarchical multiple linear regression analysis predicting participants’ T2 RISK ESTIMAtes (no exclusions for failed attention checks).

Supplemental material

Supplemental Material

Download MS Word (88.2 KB)