Figures & data
Figure 1 The Ballistat.
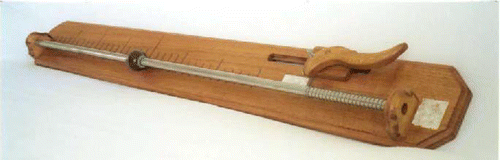
Figure 2. A top-down flowchart of the process.
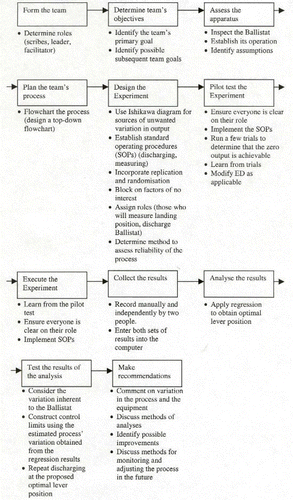
Figure 3. Isolating Sources of Variation in the Outcome using an Ishikawa Diagram.
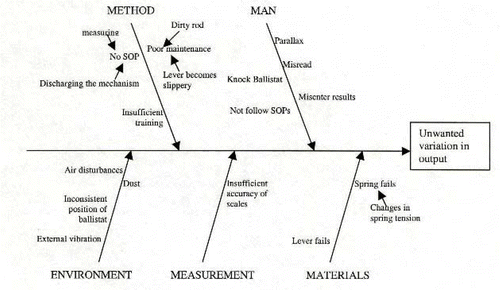
Table 1. Results of the pilot sample.
Table 2. Predictor and outcome readings from the Experiment.
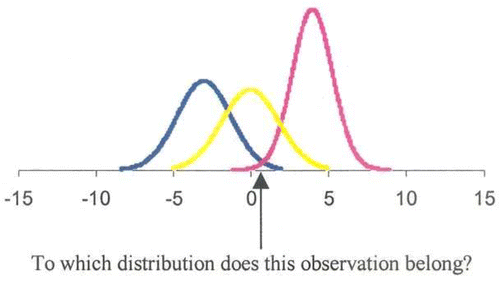
Figure 4 Exhibiting uncertainty in the distributions of landing positions for a given lever setting.