
Figures & data
Fig. 1 TAM scores, male and female.
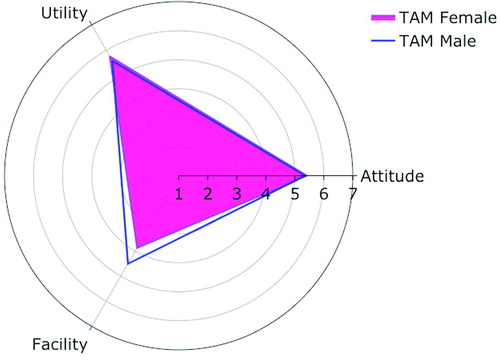
Table 1 TAM scores.
Table 2 RStudio degree of acceptance according to sex.
Fig. 2 SATS-28 pre- and post-course.
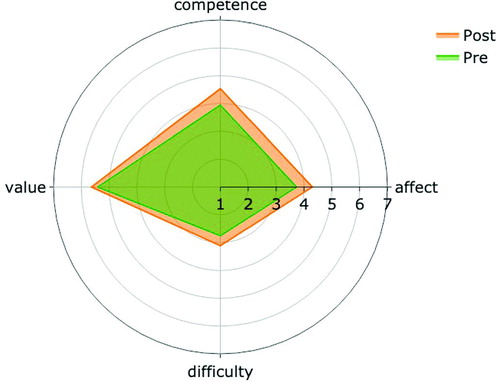
Fig. 3 SATS, females and males (pre- and post-scores).
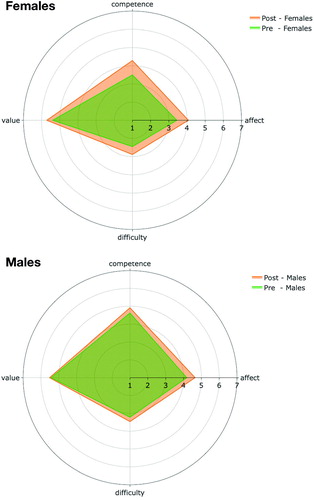
Table 3 SATS-28, scores pre- and post-course—all students.
Table 4 SATS-28, scores pre- and post-course—females (n = 26).
Table 5 SATS-28, scores pre and post course—males (n = 17).
Table 6 SATS change, according to RStudio degree of acceptance.
Table 7 Final grades, according to RStudio degree of acceptance.
Supplemental material