Figures & data
Table 1 Summary of cohort composition.
Fig. 1 Frequency polygons of the distribution of examination marks for the 2014 cohort and the 2017 cohorts with and without partial grading.
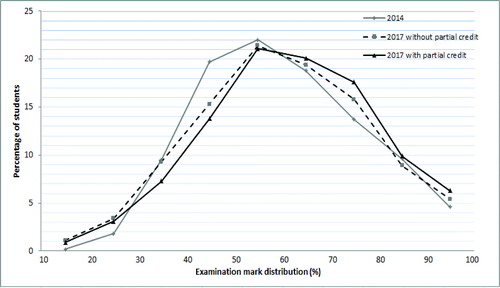
Table 2 Description of variables identified for the GLM.
Table 3 Results of GLM I with partial grading in 2017.
Table 4 Results of GLM II without partial grading in 2017.
Table 5 Summary of the four additional GLM models.
Table 6 Results of GLM VII (interaction model) with partial grading in 2017.
Fig. 2 Clustered bar graph of students’ perceptions on ten QT-clicker statements.
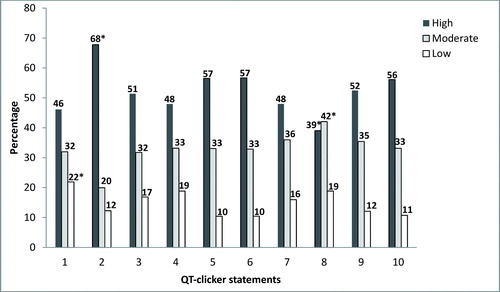
Table 7 Average statement response against final grades.
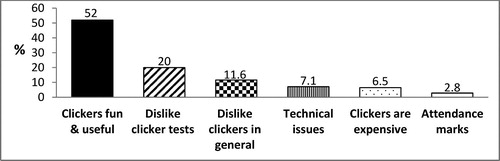
Fig. 3 Bar chart of students’ general comments on clicker use.