Figures & data
TABLE 1 Base Loading Matrix and the Derived Cluster-Specific Loading Matrices for Clusters 1 and 2, in the Case of Two Factors (Top) and in the Case of Four Factors (Bottom)
FIGURE 1 Scatter plot of CCmin versus ARI for the simulated data sets.
TABLE 2 Clustering of the Countries of the Mixture Simultaneous Factor Analysis Model With Two Clusters and Two Factors Per Cluster for the Emotion Norm Data From the 2001 ICS Study
FIGURE 2 Boxplots for (a) the Human Development Index (HDI) 1998 (United Nations Development Program, Citation2000) and (b) the level of conservatism (Schwartz, Citation1994) of the countries per cluster of the Mixture Simultaneous Factor Analysis model with two clusters and two factors per cluster for the International College Survey data set on emotion norms.
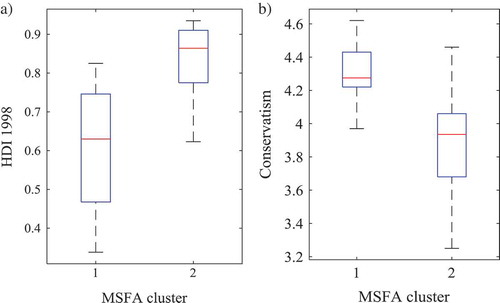
TABLE 3 Varimax (Top) and Echelon (Bottom) Rotated Loadings of the Mixture Simultaneous Factor Analysis Model With Two Clusters and Two Factors Per Cluster for the Emotion Norm Data From the 2001 ICS Study
TABLE 4 Unique Variances of the Mixture Simultaneous Factor Analysis Model With Two Clusters and Two Factors Per Cluster for the Emotion Norm Data From the 2001 ICS Study
FIGURE C.1 ‘Example.txt’ file communicating the clustering (‘Cluster’), the number of variables (‘V2’ to ‘V13’) and the data block structure (‘V1’ and ‘rows’) to the simulation syntax for LG 5.1. Note that, in general, the number of rows can differ across data blocks.