
Figures & data
FIGURE 1 Path diagram of a bivariate autoregressive and cross-lagged panel model for three waves of data.
FIGURE 2 Demonstration of iterated IPC regression. 1000 individuals were sampled in equal shares from a two-group exponential distribution with group-specific rate parameters and
. Iterated IPC regression with a dummy variable indicating grouping was used to estimate the group difference in the rate parameter. On the left side, initial and re-estimated IPC regression estimates are shown. Red dots are estimates of
and blue dots are estimates of the difference
. Dashed lines mark the corresponding maximum likelihood estimates. Clearly, the initial IPC regression estimates are biased. After just two iterations, however, the iterated IPC regression estimates approach the corresponding maximum likelihood estimates. The log-likelihood function is shown on the right side. The iterative reduction of the bias in the IPC regression estimates leads to an increase of the log-likelihood.
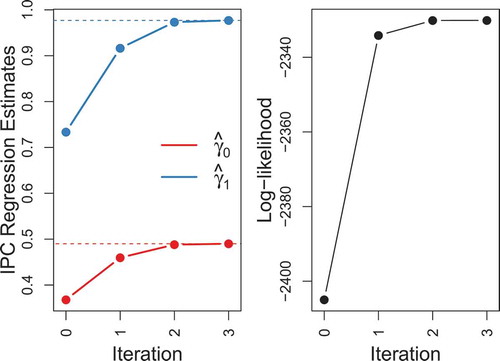
TABLE 1 Group-specific Population Parameter Values for the Dynamic Panel Models in Discrete and Continuous Time
FIGURE 3 Boxplots of the bias of the IPC regression estimates for the discrete-time dynamic panel model. Red: vanilla IPC regression, blue: iterated IPC regression.
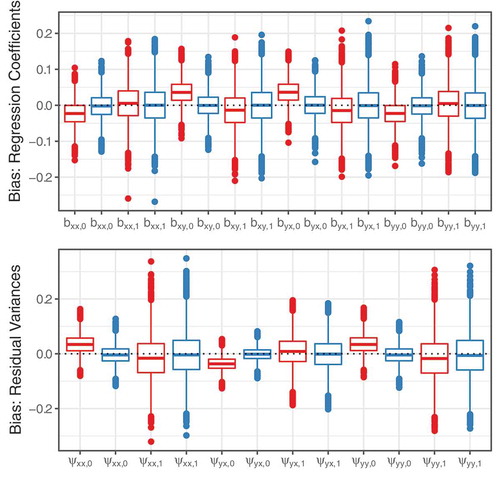
FIGURE 4 Boxplots of the bias of the IPC regression estimates for the continuous-time dynamic panel model. Red: vanilla IPC regression, blue: iterated IPC regression.
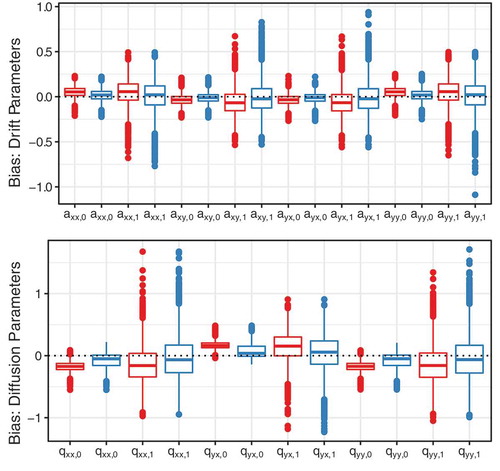
TABLE 2 Population Parameter Values for the Dynamic Panel Models Used in Simulation II.
FIGURE 5 Power to detect that the population group difference in the cross-lagged effect of the discrete-time model is non-zero. Black crosses: MGSEM, red squares: vanilla IPC regression, blue pluses: iterated IPC regression.
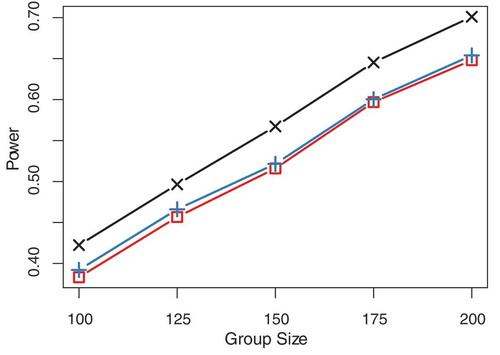
FIGURE 6 Power to detect that the population group difference in the drift parameter of the continuous-time model is non-zero. Black crosses: MGSEM, red squares: vanilla IPC regression, blue pluses: iterated IPC regression.
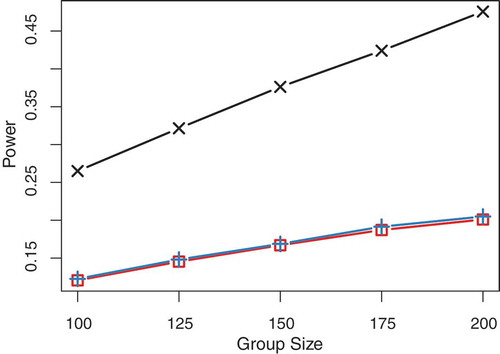
TABLE 3 Proportions of Type I Errors for the Parameters Estimates of the Discrete-time Dynamic Panel Model
TABLE 4 Proportions of Type I Errors for the Parameters Estimates of the Continuous-time Dynamic Panel Model