Figures & data
Scheme 1. HO• radicals and H• atoms are highly specific for sulfur atom attack of methionine (1).
Scheme 2. Reactive intermediates discussed in the resolution of time-resolved spectra.
Scheme 3. Suggested mechanism for the formation of αN from the HO• radical adduct to the sulfur atom (SOH) (see Scheme S1 for details)).
Scheme 4. The partition of the radical cation on Met moiety in two equilibria.

Scheme 5. Reaction mechanism for the cis-trans isomerization catalyzed by CH3S• radicals.
Figure 1. Resolution of the spectral components in the transient absorption spectrum recorded 1.4 μs after the electron pulse in N2O-saturated aqueous solution containing 0.2 mM Gly-Met-Gly at pH 5.5 (the explanation of symbols is in the legend and Scheme 2).
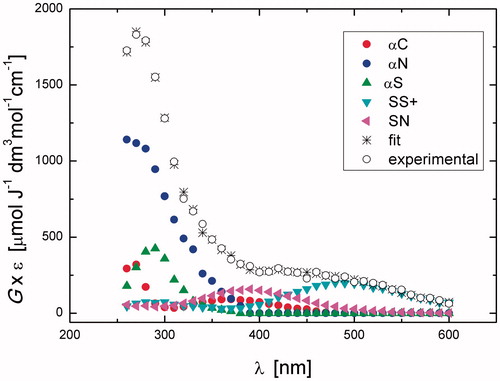
Table 1. The radiation chemical yields (G, μmol J−1) of radicals and their percentage contribution (in parenthesis) to the total yield of radicals present in the reaction of HO• with Gly-Met-Gly at different times after electron pulse at pH 5.5.
Figure 2. Resolution of the spectral components in the transient absorption spectrum recorded 1.4 μs after the electron pulse in N2O-saturated aqueous solution containing 0.2 mM N-Ac-Gly-Met-Gly at pH 5.4 (the explanation of symbols is in the legend and Scheme 2).
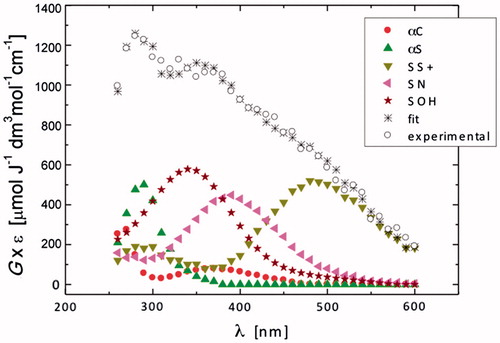
Table 2. The radiation chemical yields (G, μmol J−1) of radicals and their percentage contribution (in parenthesis) to the total yield of radicals present in the reaction of HO• with N-Ac-Gly-Met-Gly at different times after electron pulse at pH 5.4.
Figure 3. Resolution of the spectral components in the transient absorption spectrum recorded 3.75 μs after the electron pulse in N2O-saturated aqueous solution containing 0.2 mM N-Ac-Gly-Met-Gly at pH 5.4 (the explanation of symbols is in the legend and Scheme 2).
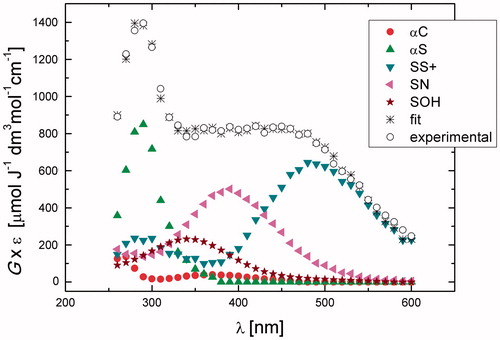
Figure 4. (A) HPLC traces showing the oxidation of Gly-Met-Gly (green peak) to Gly-Met(O)-Gly (red peak) by H2O2. Samples were withdrawn every hour, followed by OPA derivatization (detecting amino compounds) and HPLC analysis. (B) Time course of the conversion of Gly-Met-Gly ![]()
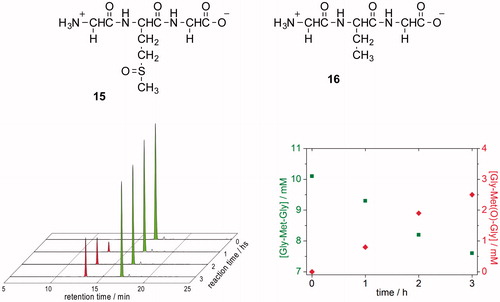
Figure 5. HPLC traces of γ-irradiated of N2O:O2 (90:10 v/v)-saturated solutions of 1.10 mM Gly-Met-Gly at natural pH (dose rate ∼5.5 Gy min−1) after OPA derivatization.
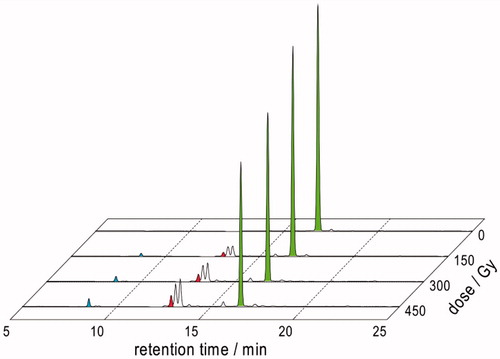
Table 3. G-values calculated from the HPLC analyses of γ-irradiated N2O:O2 (90:10 v/v)-saturated solutions (oxygenated) or N2O-saturated solutions (deaerated) of 1.10 mM Gly-Met-Gly at natural pH (dose rate ∼5.5 Gy min−1) after OPA derivatization.
Figure 6. HPLC traces of γ-irradiation of N2O-saturated solutions of 1.10 mM Gly-Met-Gly at natural pH (dose rate ∼5.5 Gy min−1) after OPA derivatization.
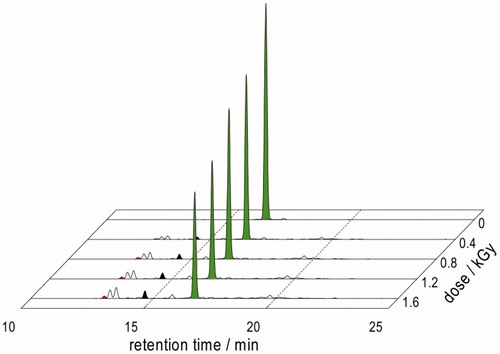
Figure 7. LC–MS analyses of γ-irradiated solutions of 1.10 mM Gly-Met-Gly at natural pH: (A) N2O:O2 (90:10 v/v)-saturated at a dose of 450 Gy; (B) N2O-saturated at a dose of 1600 Gy.
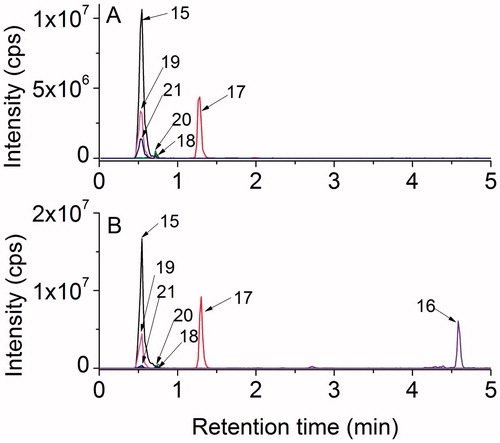
Figure 8. Structures of identified compounds based on high-resolution MS/MS spectra.
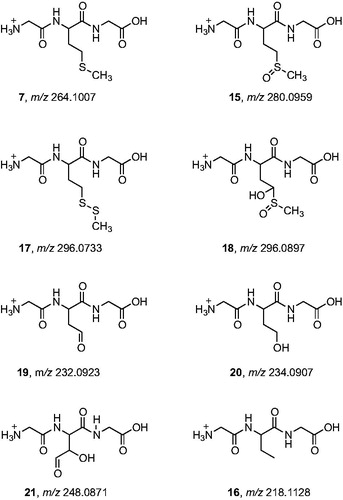
Figure 9. High-resolution MS/MS spectra of starting material 7 (m/z 264.1007) and of the products with higher molecular weight 15 (m/z 280.0959), 17 (m/z 296.0733), and 18 (m/z 296.0897) with proposed structures of the fragment ions.
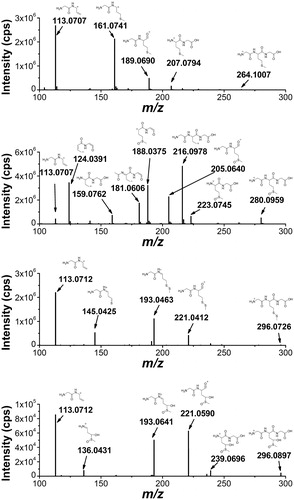
Figure 10. High-resolution MS/MS spectra of the products with lower molecular weight that the starting tripeptide: 19 (m/z 232.0923), 20 (m/z 234.0907), 21 (m/z 248.0871), and 16 (m/z 218.1128) with proposed structures of the fragment ions.
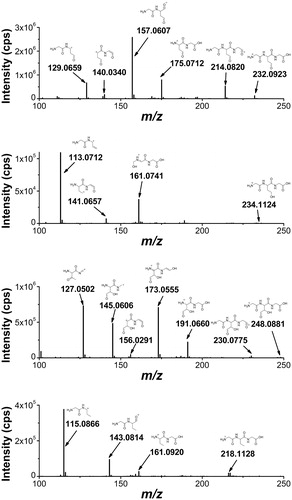
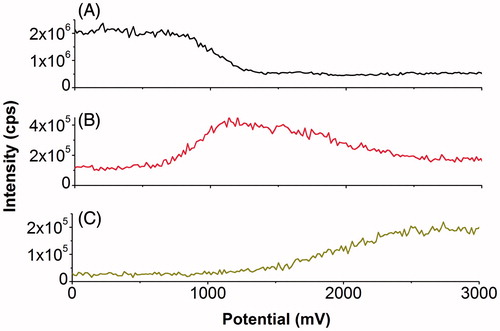
Figure 11. On-line mass-voltammograms of Gly-Met-Gly electrochemical oxidation. On-line mass-voltammograms of Gly-Met-Gly (20 μM in 89/10/1 (v/v/v) water/acetonitrile/formic acid) were recorded by ramping the potential from 0 to 4000 mV with a scan rate of 20 mV/s. Traces were extracted and plotted versus cell potential for A: Gly-Met-Gly, B: Gly-Met(O)-Gly and C: Gly-Met(O2)-Gly.
Scheme 6. Proposed mechanism for the reaction of HO• radicals with Gly-Met-Gly (7).
Scheme 7. Proposed mechanism for the formation of to α-aminobutyric moiety (16).