Figures & data
Table 1. Composition of the prepared plain and drug-loaded Alb MS.
Figure 1. Effect of (a) span 80 concentration (% w/v), (b) EL concentration (% w/v), (c) theoretical loading (% w/w) and (d) glutaraldehyde concentration (% w/v) on the particle size and entrapment efficiency % w/w of Enox-Alb MS. D90 is the diameter where 90% of the population lies below this value.
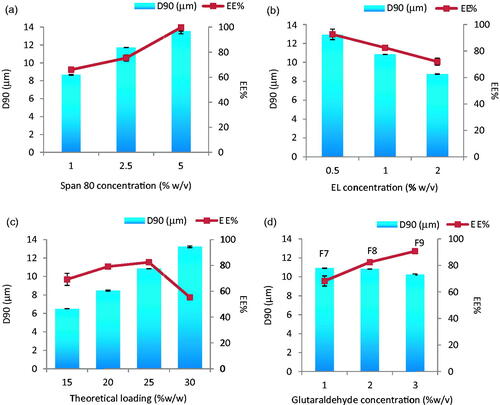
Figure 2. Release profiles from Enox-Alb MS in PBS pH 7.4 at 37 °C.
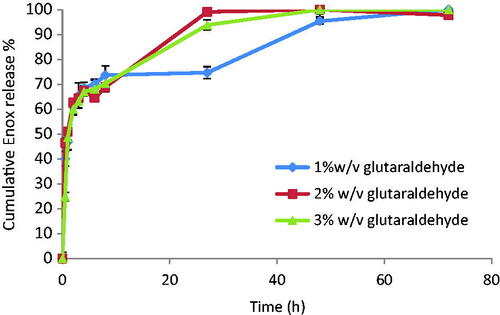
Figure 3. SEM micrographs of freeze dried (a) plain and (b) Enox-Alb MS of formula F8. Magnification ×2700.
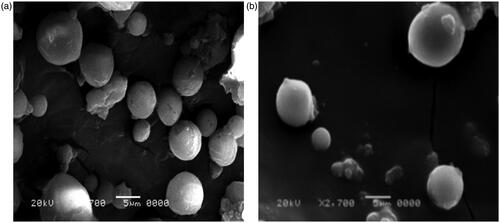
Figure 4. FT-IR spectra of albumin, enoxaparin, plain Alb MS and Enox-Alb MS.
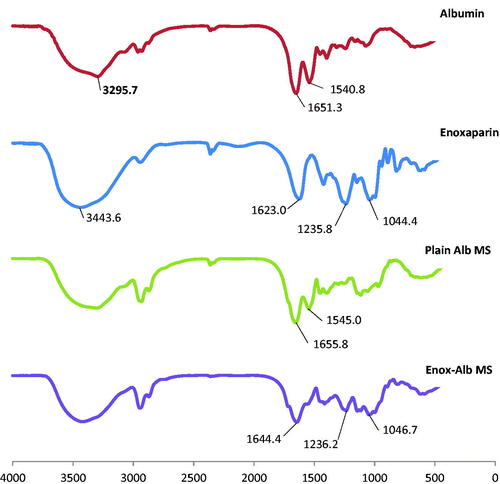
Figure 5. Fluorescent microscopic images of microtome sections of rat lung (a) 10 min, (b) 6 h, (c) 24 h, (d) 48 h post-IV administration of FITC-dextran loaded Alb MS and (e) confocal microscopic images of rat lung at various depths, 30 min post-IV administration of FITC-dextran loaded Alb MS. Magnification ×200.
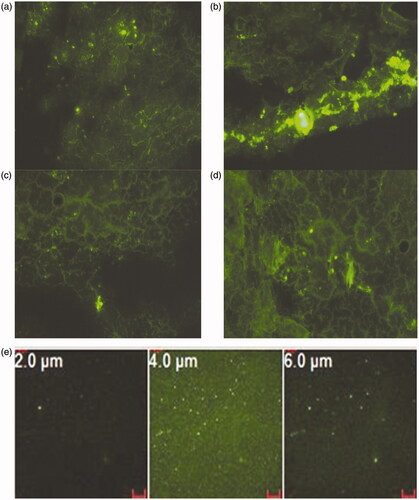
Figure 6. Light photomicrograph of rat lung 24 h post-IV administration of (a) D5W and (b) formula F8 at a magnification of ×160 (a: air alveoli, b: bronchiol and v: blood vessel).
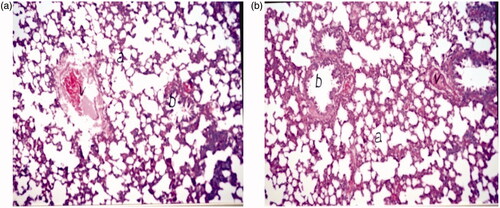
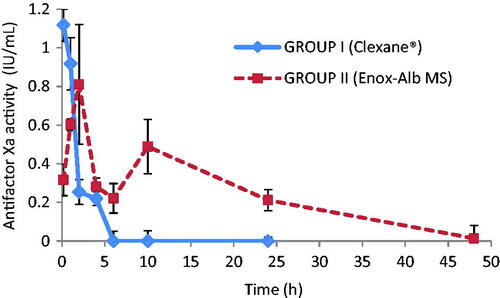
Figure 7. AntifactorXa activity versus time curve for Enox following IV administration of Clexane® and Enox-Alb MS (F8).