Figures & data
Figure 1. HPLC profile of VAC extract at 260 nm. 1. 3,4-Dihydroxybenzoic acid; 2. 4-Hydroxybenzoic acid; 3. Isoorientin; 4. Agnuside; 5. Isovitexin; 6. Luteolin; 7. Apigenin; 8. Penduletin; and 9. Casticin.
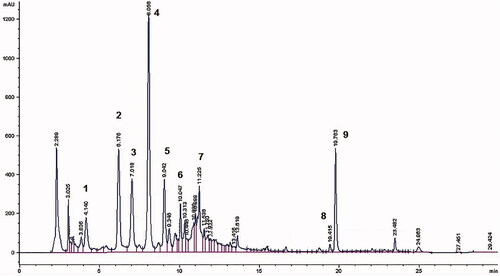
Table 1. Intermediate precision: RSD % values intraday and interday.
Table 2. Solubility of VAC constituents in different vehicles (mean ± S.D., n = 3).
Figure 2. Pseudo ternary phase diagram of microemulsion (S mix: 1:1, Labrasol and Cremophor EL). Light gray: turbidity; gray: NE; and black: gel.
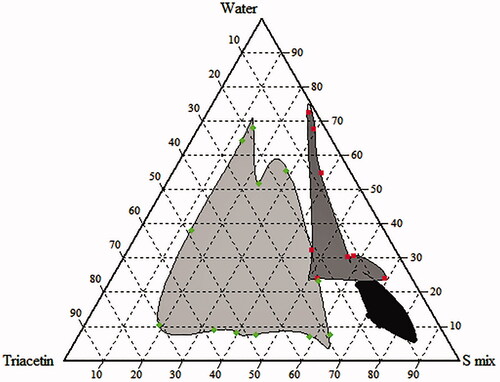
Table 3. Solubility of VAC extract into NE.
Figure 3. Chemical stability of flavonoids and iridoids of VAC extract formulated into NE after storage at 4 °C for 2 months (each data point represents the average of three samples).
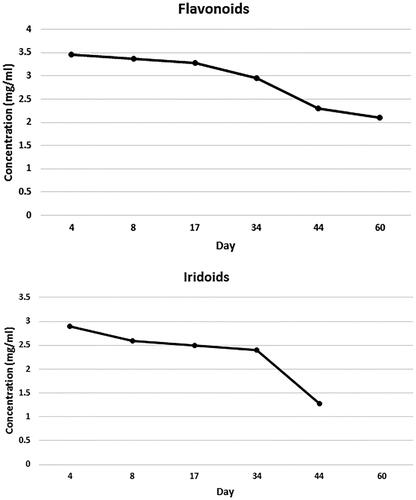
Figure 4. Comparative PAMPA permeability: micrograms of total flavonoids (F) and iridoids (I) of extract of VAC permeated from NE and from saturated aqueous solution (W). Average values ± S.D. of experiments carried out in triplicate are presented. *p < 0.05.
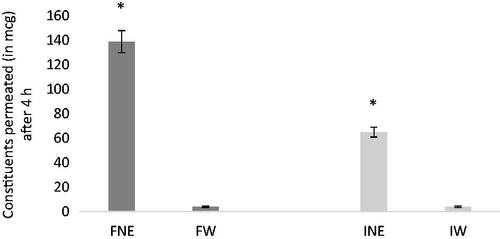
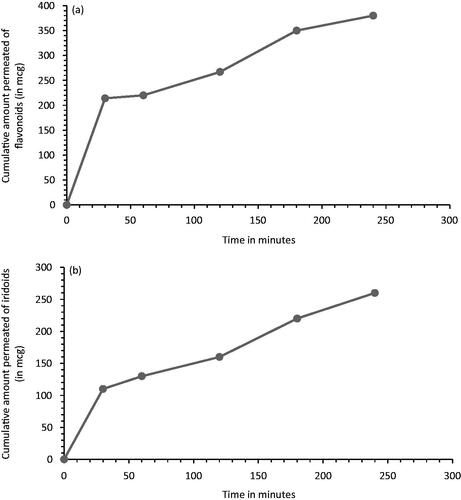
Figure 5. Caco-2 permeability of flavonoids (a) and iridoids (b) loaded into NE (each data point represents the average of three samples).