Figures & data
Figure 1. SEM images depicting the morphology of ribavirin-excipient agglomerates obtained with (A–A’) mannitol/lecithin microparticles (AM1); (B–B’) chitosan/lecithin microparticles (AM2), and (C–C’) α-cyclodextrin/lecithin microparticles (AM3) at 250× and 1200× magnification.
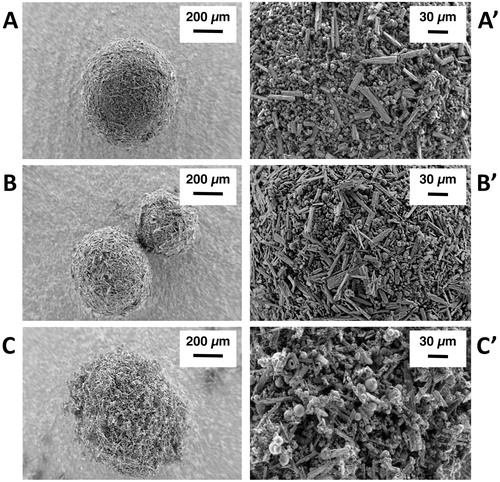
Table 1. Yield of agglomeration (%), ribavirin content in the blends before agglomeration and in the final agglomerates produced (n = 3, average ± SD).
Figure 2. Ribavirin permeated (% of loaded dose) across rabbit nasal mucosal tissue from μRBV (×), and agglomerates obtained from micronized ribavirin crystals with mannitol/lecithin microparticles AM1 (▪), chitosan/lecithin microparticles AM2 (△) or α-cyclodextrin/lecithin microparticles AM3 (•) (n = 3, average ± SD).
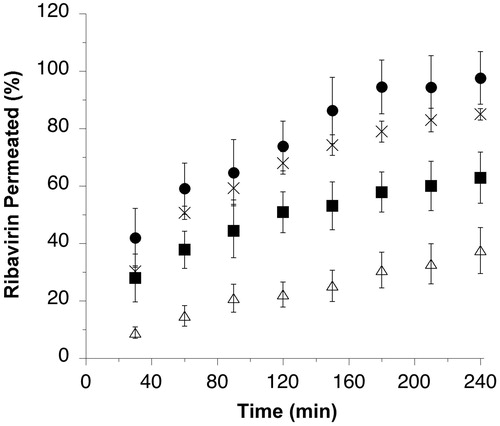
Figure 3. The panels are showing: (1) dry powder insufflator device; (2) tip insertion in the nose of an animal; (3) distribution in the nasal cavity of agglomerates containing a blue marker, arrows indicate regions where the staining is more evident; (4) sketch showing the relative positioning of the trigeminal nerve (A), olfactory nerves (B) and brain (C) in the animal head (reproduced with permission from Dhuria, Citation2010); (5) data related to in vitro powder delivery performance of the dry powder insufflator device (n = 4, mean ± SD); **significantly different from ?RBV emitted powder, p < .01.
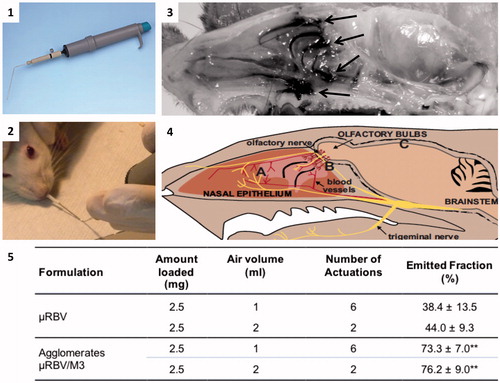
Figure 4. Ribavirin distribution in plasma and different brain compartments (OB: olfactory bulb; BG: basal ganglia; Hip: hippocampus; CTX Ant: anterior cortex; CTX Post: posterior cortex; CRB: cerebellum) after the nasal administration of micronized ribavirin crystals (white bars) or agglomerates obtained with micronized ribavirin and α-cyclodextrin/lecithin microparticles (AM3) (black bars) (n = 6, average ± SEM).
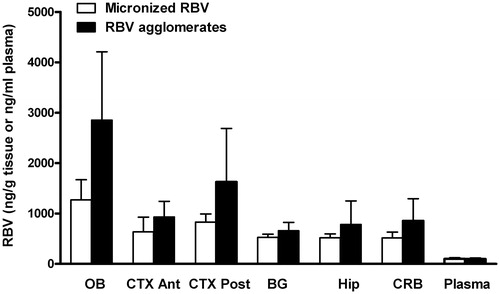
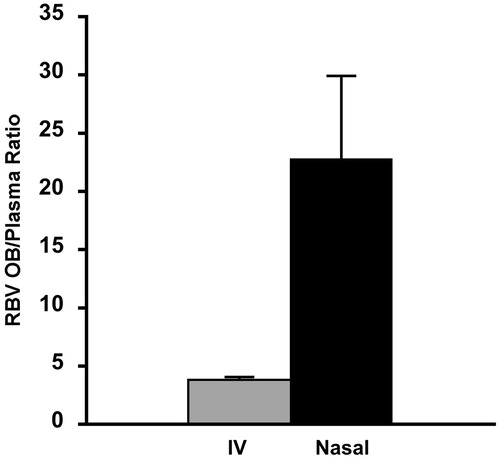
Figure 5. Olfactory bulb to plasma ratio (OB/plasma ratio) after nasal administration of the same dose of ribavirin (1 mg) by intravenous injection (grey bar) or nasal administration of ribavirin agglomerates with α-cyclodextrin excipient microparticles (black bar) (n = 6, average ± SEM). Data for the intravenous administration are according to Colombo et al., 2011.