
Figures & data
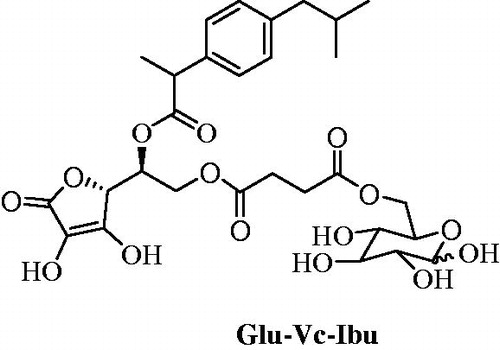
Figure 1. The structure of ibuprofen prodrug Glu-Vc-Ibu.
Scheme 1. Synthesis of prodrug Glu-Vc-Ibu. Reagents and conditions: (a) NaH, BnBr, DMF, r.t.; (b) Ac2O-AcOH, ZnCl2, r.t.; (c) CH3ONa, CH3OH, r.t.; (d) succinic anhydride, DMAP, CH2Cl2, r.t.; (e) acetone, acetyl chloride, r.t.; (f) BnBr, K2CO3, acetone, reflux; (g) HCl, CH3CN, 30 °C; (h) 8, DCC, DMAP, CH2Cl2, r.t.; (i) ibuprofen, DCC, DMAP, CH2Cl2, r.t.; (j) Pd/C, H2, CH3OH, r.t.
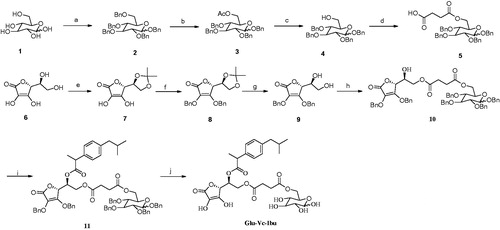
Table 1. Chemical stability of prodrugs at 37 °C.
Table 2. Metabolic stability of prodrugs in mice plasma extracts and brain homogenate at 37 °C.
Figure 2. Cell viability upon addition of prodrugs in PC12 cells. Cell viability was expressed as a percentage of the control cell culture. Values are represented as mean ± SD (n = 3).
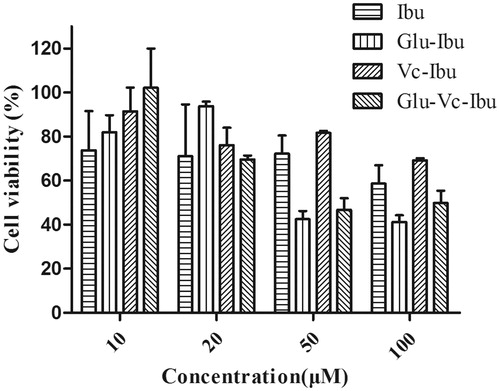
Figure 3. The neuroprotective effect of ibuprofen and the prodrugs. (A) Cell viability, (B) ROS level of ibuprofen and the prodrugs groups after H2O2 treatment in vitro, (C) SOD activity of ibuprofen and the prodrugs groups after H2O2 treatment in vitro. Cell morphology (D–I) in PC12 cells under hydrogen peroxide condition, (D) untreated PC12 cell, (E) PC12 cell exposed to H2O2 for 2 h, (F) PC12 cells pro-incubated with ibuprofen for 4 h and exposed to H2O2 for 2 h, (G) PC12 cells pro-incubated with Glu-Ibu for 4 h and exposed to H2O2 for 2 h, (H) PC12 cells pro-incubated with Vc-Ibu for 4 h and exposed to H2O2 for 2 h, (F) PC12 cells pro-incubated with Glu-Vc-Ibu for 4 h and exposed to H2O2 for 2 h. ***p < .001, a indicates significance at p < .05 versus H2O2 group, b indicates significance at p < .05 versus ibuprofen group, c indicates significance at p < .05 between Glu-Ibu or Vc-Ibu group and Glu-Vc-Ibu group. Data represent mean ± SD (n = 3).
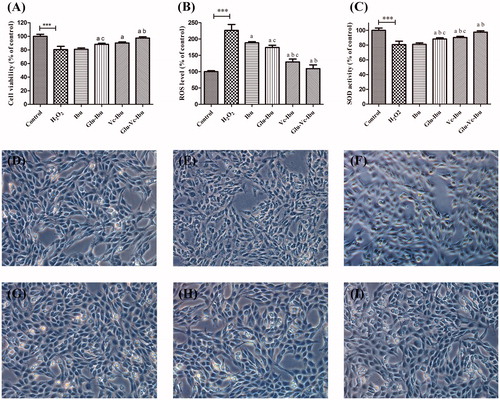
Figure 4. The neuroprotective effect on brain ischemia model. (A) TTC staining of the brain sections, (B) percentage of TTC staining rate compared with the sham group, (C) SOD activity, (D) MDA level, (E) GSH level. **p < .01, ***p < 0.001, a indicates significance at p < .05 versus saline group, b indicates significance at p < .05 versus ibuprofen group, c indicates significance at p < .05 between Glu-Ibu or Vc-Ibu group and Glu-Vc-Ibu group. Data are presented as mean ± SD (n = 5).
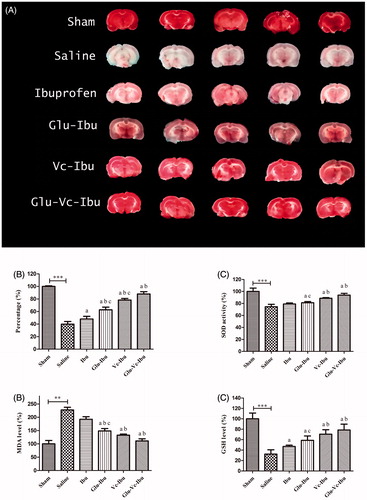
Figure 5. Concentration curves in plasma versus time after administration of Ibu, Glu-Ibu, Vc-Ibu and Glu-Vc-Ibu (hydrolysis, n = 3).
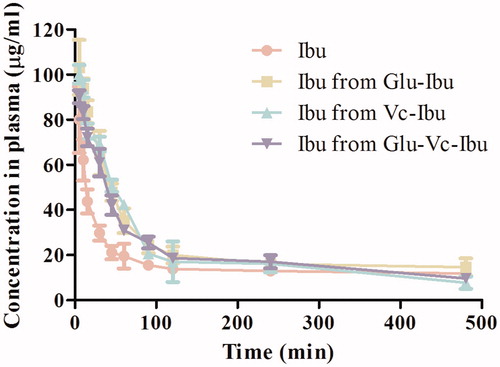
Table 3. Pharmacokinetic parameters in plasma (hydrolysis, n = 3).
Figure 6. Concentration curves in brain homogenate versus time after administration of Ibu, Glu-Ibu, Vc-Ibu and Glu-Vc-Ibu (hydrolysis, n = 3).
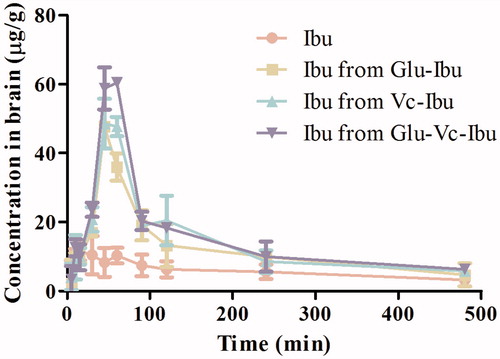
Table 4. Pharmacokinetic parameters of ibuprofen in brain homogenate (hydrolysis, n = 3).