Figures & data
Figure 1. Synthesis and characterization of CSA-DNPs. (A) Schematic illustration of the single-step sonication method to synthesize CSA-DNPs. (B) Size distribution of the different nanoparticles. (C) DOX release profiles of free DOX, DNPs, SCR-DNPs, and CSA-DNPs in PBS. The data are shown as the means ± SD (n = 3). (D) TEM image of the CSA-DNPs. The scale bar represents 100 nm (left) and 50 nm (right).
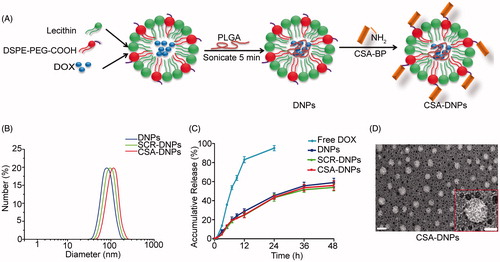
Figure 2. In vitro cell uptake and subcellular localization of CSA-DNPs. (A) JEG3 cells analyzed by fluorescence microscopy after a 30-min incubation with 5 μg/mL of different DOX-loaded nanoparticles. The scale bar represents 50 μm. (B) The corresponding quantitative analysis of the cellular fluorescent signal using flow cytometry. Values are expressed as the means ± SD (n = 3). (C) Quantitative analysis of the DOX content in different groups using a fluorescence spectrophotometer (data represent the means ± SD, n = 3). (D) Subcellular colocalization of the CSA-DNPs in JEG3 cells after a 30-min incubation with the CSA-DNPs. Nuclei were stained with Hoechst 33258, and lysosomes were stained with LysoTracker. Scale bar: 10 μm. ***p < .001 compared with the DNPs.
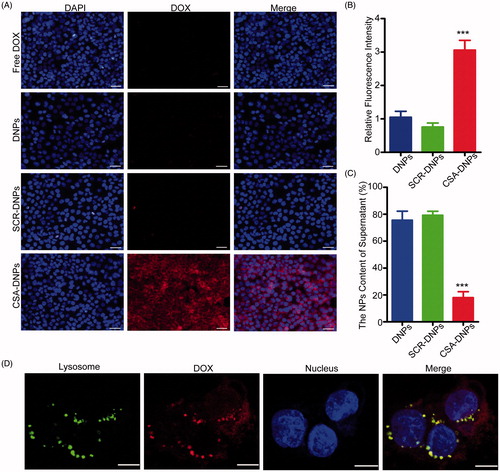
Figure 3. Cell cytotoxicity assay. (A) Quantitative evaluation of the viability of JEG3 cells treated with free DOX and the different nanoparticles for 24 h. *p < .05, **p < .01 compared with free DOX. (B) Apoptosis of JEG3 cells after incubation with or without the different nanoparticles (n = 3). **p < .01, ***p < .001 compared with PBS.
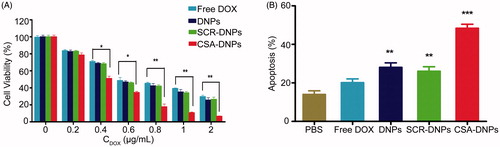
Figure 4. Imaging of CSA-BP-modified INPs in vivo. (A) Nude mice bearing Fluc-GFP-JEG3 tumors (left row) were intravenously injected with the CSA-INPs or INPs (1 mg/kg ICG equivalent). Mice were sequentially imaged from 10 min to 48 h using an IVIS spectrum imaging system. (B) Quantification of the IVIS signal from the Fluc-GFP-JEG3 tumors at different time intervals from 10 min to 48 h after the CSA-INPs injection. (C) Immunofluorescence staining of Fluc-GFP-JEG3 tumor tissues 48 h after the CSA-INPs intravenous injection. The sections were imaged using confocal microscopy. Scale bar: 20 μm.
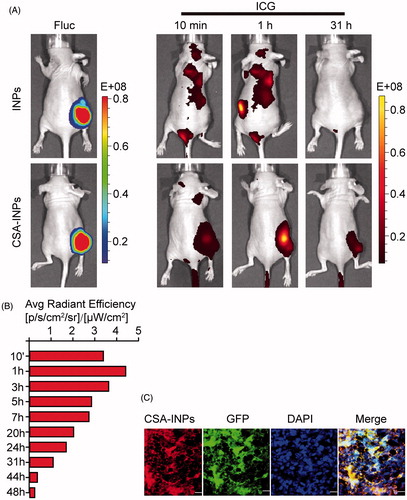
Figure 5. CSA-targeted DNPs inhibited primary tumor growth in mice after systemic administration. (A) IVIS analysis of Fluc-GFP-JEG3 tumor growth in mice receiving different treatments at the indicated time points. At day 2 after the xenograft implantation, the mice (n = 5) received an intravenous injection of different nanoparticles (10 mg/kg DOX equivalent); these injections were repeated every other day. (B) Quantification of the total photon flux in mice (from A) at day 18 after the xenograft (data represent the means ± SD, n = 5, **p < .01). (C) Caliper measurements of the xenograft volume in mice after the intravenous injection of PBS, free DOX, the DNPs, SCR-DNPs, or CSA-DNPs were repeated every other day (data represent the means ± SD, n = 5). No tumors were observed in the CSA-DNP group. (D) Kaplan–Meier’s survival curve comparison of tumor-bearing mice treated with PBS, free DOX, the DNPs, SCR-DNPs, or CSA-DNPs. The mice were sacrificed when they reached their humane endpoint. Statistical significance (**p < .01) was calculated using the Chi2 log-rank test of free DOX, the DNPs, SCR-DNPs, and CSA-DNPs compared with PBS. (E) Change in the body weight of mice bearing Fluc-GFP-JEG3 tumors receiving different treatments (means ± SD, n = 5). No significant difference among the various treatment groups was observed at any time point.
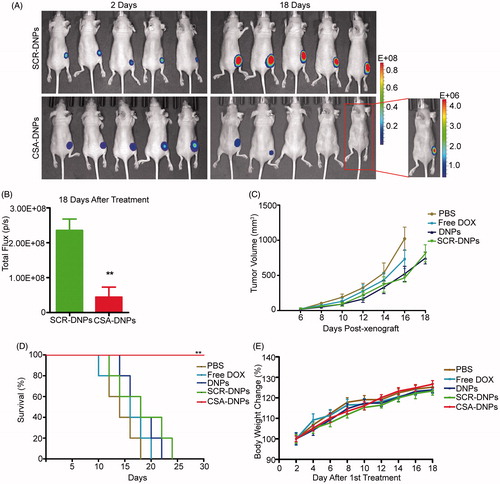
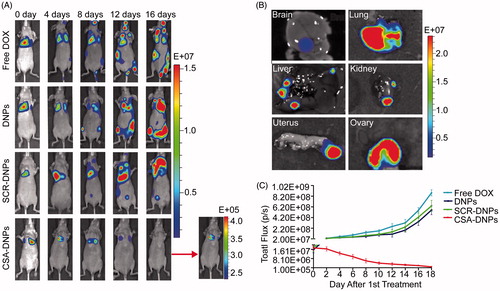
Figure 6. CSA-targeted DNPs inhibited choriocarcinoma metastases in mice. (A) IVIS images of mice after receiving intravenous injections of different nanoparticles. At day 2 after the xenograft implantation, the mice (n = 5) received an intravenous injection of free DOX, the DNPs, SCR-DNPs, or CSA-DNPs (10 mg/kg DOX equivalent); these injections were repeated every other day. (B) IVIS images of the organs in nude mice 10 days after receiving an intravenous injection of Fluc-GFP-JEG3 cells. A total of 106 Fluc-GFP-JEG3 cells were intravenously injected via the tail vein, and the mice were analyzed by autopsy and bioluminescent image after 10 days. (C) Quantification of the total photon flux in mice (from A) after injection of the Fluc-GFP-JEG3 cells (data represent the means ± SD, n = 5).