Figures & data
Table 1. Optimum preparation condition and characteristics of FSD micro and nanoparticles.
Figure 1. Plasma pharmacokinetics of FSD and its formulations. Different formulations of FSD (c-FSD, m-FSD and n-FSD) were administered to rats (0.4 mg/ml), blood samples were taken from retro-orbital plexus at different time points and plasma concentrations of FSD (A), maximum FSD concentration (B) and plasma overall exposure to FSD (C) were plotted. Data are expressed as mean ± SEM; n = 3; (*) indicates significantly different from corresponding control at p < .05.
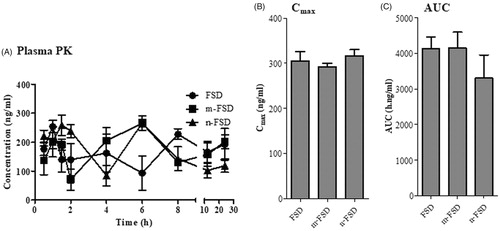
Figure 2. Tissue distribution of FSD and its formulations. Different formulations of FSD (c-FSD, m-FSD and n-FSD) were administered to rats (0.4 mg/ml), tissue samples such as prostate (A), liver (B), spleen (C), kidney (D), lung (E) and testis (F) were surgically extracted immediately after euthanasia and concentrations of FSD within the selected organs were plotted against time. Data are expressed as mean ± SEM; n = 3; (*) indicates significantly different from corresponding control at p < .05.
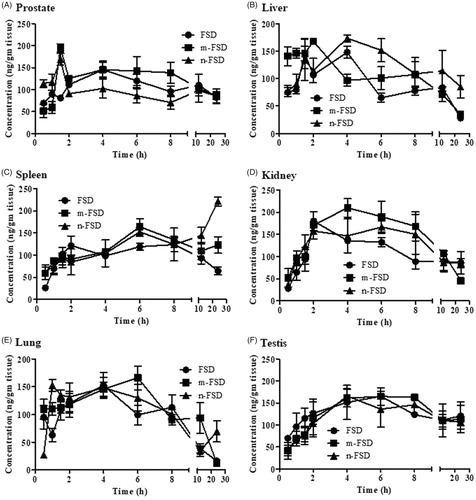
Figure 3. Tissue exposure parameters of FSD and its formulations. Different formulations of FSD (c-FSD, m-FSD and n-FSD) were administered to rats (0.4 mg/ml), tissue samples of prostate, liver, Spleen, Kidney, lung and testis were surgically extracted immediately after euthanasia and maximum concentrations (Cmax) of FSD (A) and total tissue exposure (AUC) to FSD were plotted. Data are expressed as mean ± SEM; n = 3; (*) indicates significantly different from corresponding control at p < .05.
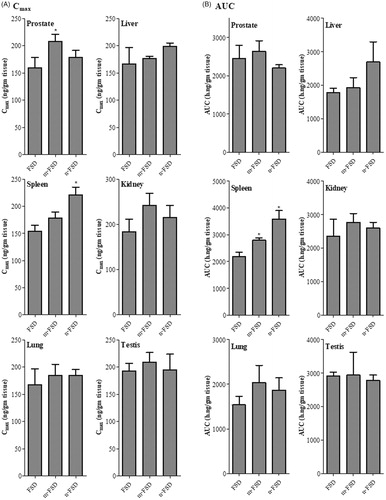
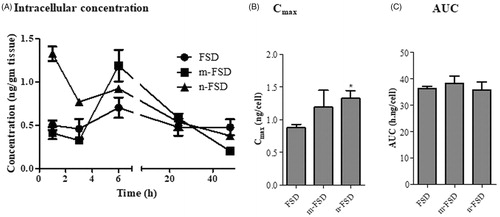
Figure 4. Cellular permeation of FSD and its formulations. Normal prostate epithelial cells (BPH cells) were exposed to 10 µg/ml different formulations of FSD (c-FSD, m-FSD and n-FSD), intracellular concentration of FSD were assessed after different time points (A), intracellular Cmax (B) and intracellular AUC (C) were plotted. Data are expressed as mean ± SEM; n = 3; (*) indicates significantly different from corresponding control at p < .05.