Figures & data
Figure 1. Illustration of the procedures to synthesize polyurethane (PN) and kartogenin (KGN) conjugated PN (PN-KGN) nanoparticles and structures of PN and PN-KGN (A–C). General scheme of in vivo experimental procedures in the surgically induced rat OA model. The rats were randomized into four groups: Control group, IA injections of saline; PN group, IA injections of PN; KGN group, IA injections of KGN; and PN-KGN group, IA injections of PN-KGN. IA injections were performed every three weeks at 0, 3, 6, and 9 weeks. Rats were sacrificed for analysis at 3, 6, and 12 weeks (D).
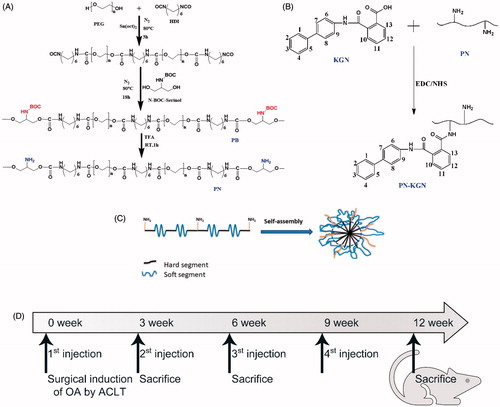
Figure 2. Typical FTIR (A) and 1H NMR spectra (B) showing the successful crosslink formation between PN and KGN, and the enhanced peaks at 1703 cm−1 (A) and 7.2 ppm (B) indicating the formation of amide bonds in PN-KGN. Transmission electron micrographs of PN-KGN, bar = 200 nm (C). In vitro release of KGN from PN-KGN at 37 °C (D).
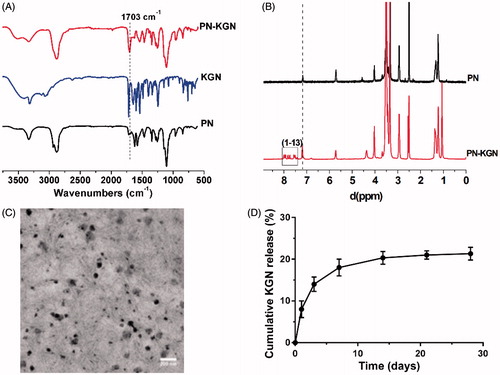
Figure 3. Cytotoxicity tests in chondrocyte with various doses of PN-KGN that can maximally release KGN to 0, 10, and 100 nM. The cell numbers were detected by CCK-8 at days 1, 4, and 7 (A). IL-6 secretions from chondrocytes were detected by ELISA after incubation with LPS (1 µg/ml), PN and PN-KGN that can release KGN to 100 nM (B). Data were shown as mean ± SD. N = 3, *p < 0.05.
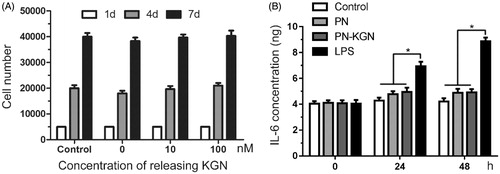
Figure 4. Macroscopic views of OA development at 3, 6, and 12 weeks after OA induction in four groups: Control group, IA injections of 100 µL saline; PN group, IA injections of 100 µL saline with PN; KGN group, IA injections of 100 µL saline with 100 µM KGN; and PN-KGN group, IA injections of 100 µL saline with PN-KGN that can release 100 µM KGN (n = 6 per group). Arrows indicate the locations of cartilage degeneration.
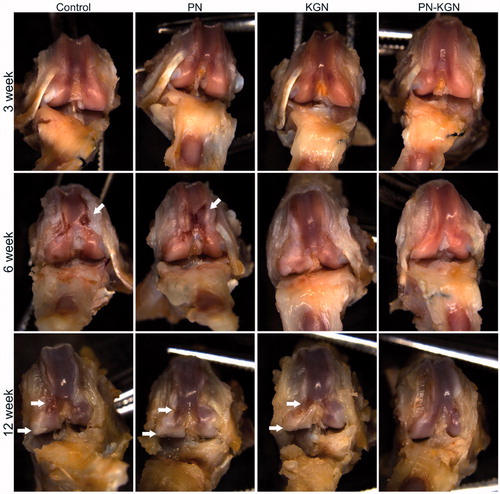
Figure 5. Safranin-O/fast green staining of OA progress at 3, 6, and 12 weeks after OA induction in Control group, PN group, KGN group and PN-KGN group. Stars: delamination of superficial layers, arrows: erosion and denudation of cartilage, arrow heads: matrix vertical fissures, circles: superficial fibrillation. Bar = 500 µm (A). OARSI scores of the four groups at indicated time points, which grade histopathology of OA and reflect the lesion depth and extent of OA over the joint. Data were shown as mean ± SD. *p < 0.05 (B).
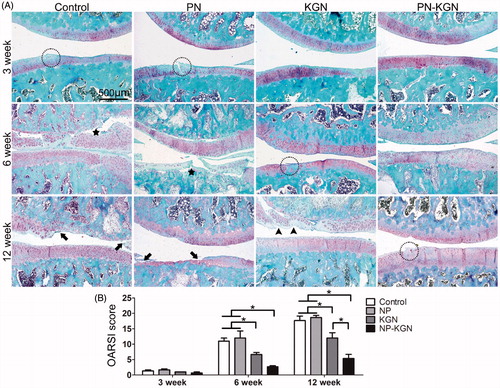
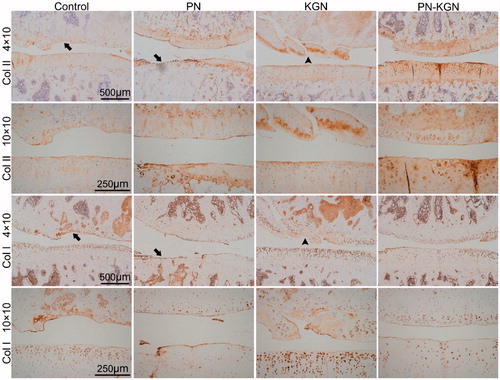
Figure 6. Immunohistochemistry staining for collagen II (Col II) and collagen I (Col I) in Control group, PN group, KGN group and PN-KGN group at 12 weeks. Arrows: cartilage erosion and denudation, arrow heads: matrix vertical fissures. Bar = 500 µm or 250 µm.