Figures & data
Figure 1. Fluorescence spectra of PpIX in various TEL-liposomes and their freeze-fractured micrographs (A). The fluorescence of PpIX in TEL9mol% (a1), TEL29.9 mol% (a2) and TEL62mol% (a3) based liposomes for TL: PpIX 10 (![]()
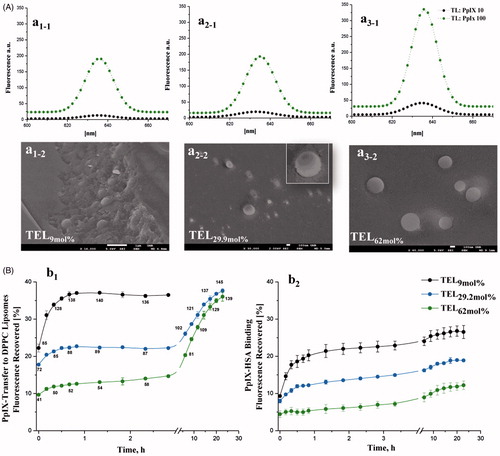
Figure 2. Photo cytotoxicity and dose-dependent effect of PpIX in SKOV-3 (A) and L929 (B) cells. After incubation with TEL9mol% liposomes (a1 and b1) or TEL62mol% (a2 and b2) liposomes at TL: PpIX 10 (tPpIX = 3h), cells were light irradiated at a series of radiant exposure doses of 134, 202, 403 and 672mJ.cm−2 (irradiance = 22 W.m−2). Cell survival is represented as a percentage of control-cell growth in cultures containing no PpIX. Cell proliferation was quantified colorimetrically using MTT assay. Half-maximal inhibitory concentrations (IC50) for PpIX were calculated from the fitted dose–response curves. In graph a3, elevated generation of singlet oxygen in SKOV-3 after various cPDT treatments with PpIX at the same radiant exposure doses is presented. Each point represents the mean of quintuplicates (n = 5) ±SD of three separate experiments; ***p < .001.
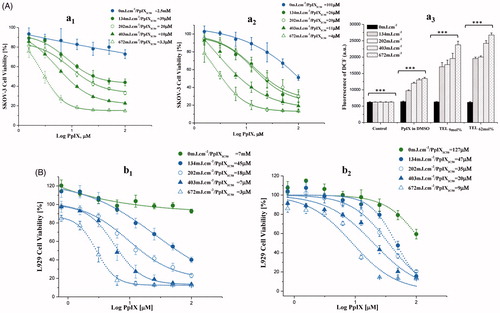
Figure 3. Confocal laser scanning acquisitions of L929 cells treated with various TEL-liposomes at PpIX =25 µM. Image acquisitions of TEL9mol % liposomes (a1(t=1h), a2(t=3h)) and TEL62mol % liposomes (b1(t=1h), b2(t=3h)) and free PpIX (c1(t=1h), c2(t=3h)) are presented. (1) DAPI localized nuclei images, (2) empty channel, (3) PpIX fluorescence images and (4) merged images (magnified, right panel). Z-Stack mode acquisition of b2 shows the cellular co-localization of PpIX in the cytoplasm after incubation with TEL62mol% liposomes (tPpIX=3h). The total stack size was 9.5 μm with scale of 0.5 μm each.
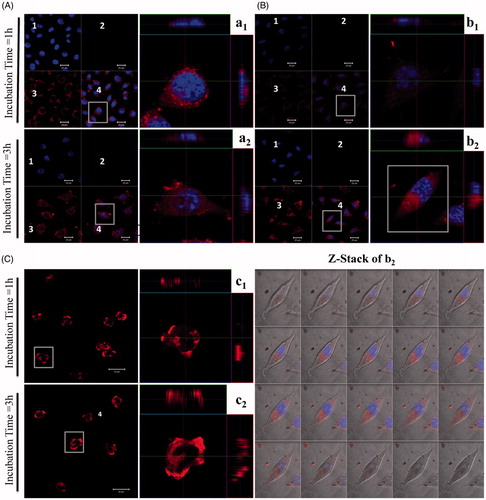
Table 1. Particle size and zeta potential measurements of TEL-liposomes.
Table 2. In vitro PpIX release kinetics and mechanisms from TEL-liposomes.
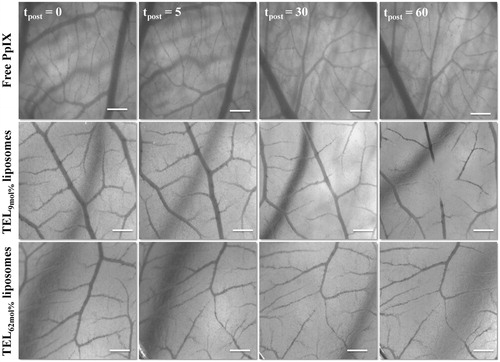
Figure 4. Stereomicrographs of CAM represent the occlusion of CAM vasculature mediated photodynamic therapy (vPDT). Image acquisitions were performed at 5 minutes before PDT (tpost 0) and at tpost 5, 30, and 60 minutes after PDT following IV-injection of free PpIX in 20% PEG 16000 containing HEPES-buffered saline, PpIX in TEL9mol% or in TEL62mol% liposomes at TL: PpIX ratios of 10. Bar represents 500 μm.